In[]:=
experiment=TrainPiecewise[RRnet[{5,5,5,5}],TargetDevice->"GPU"][[-1,-1]];
In[]:=
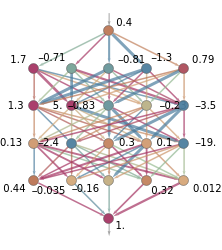
NetGraphPlot[experiment,{.4},"AddArrows"->True,ImageSize->{Automatic,140}]
Out[]=
With Activations
With Activations
In[]:=
Clear[NetGraphPlotX]Options[NetGraphPlotX]=Join[Options[Graph],{"LayerTypes"->{LinearLayer},RandomSeeding->1234,"AddArrows"->False}];NetGraphPlotX[net_,input:{__?NumericQ}:None,opts:OptionsPattern[]]:=Module{initnet,layerpattern,values,colors,linear,n,edges,g,edgestyle,cfun=ChatTechColors["Dark"]},initnet=NetInitialize[net,RandomSeeding->OptionValue[RandomSeeding]];layerpattern=Alternatives@@Blank/@OptionValue["LayerTypes"];linear=Cases[Information[initnet,"LayersList"],layerpattern];n=Replace[First@Values[Information[#,"InputPorts"]],"Real"|{}->1]&/@linear;edges=Flatten@MapThread[LayerGraph,{linear,Prepend[Most@Accumulate[n],0]}];g=Graph[edges];Ifinput=!=None,values=Flatten@Prepend[Values@initnet[input,NetPort[#,"Output"]&/@Keys[Select[Information[initnet,"Layers"],MatchQ[layerpattern]]]],input];colors={EdgeForm[GrayLevel[.3,.5]],cfun[#]}&/@values;g=Graph[g,VertexLabels->None,VertexStyle->Thread[Range[Length[values]]->colors]],g=Graphg,VertexStyle->DirectiveEdgeForm[GrayLevel[.3,.5]],;g=Graph[g,FilterRules[{opts},Options[Graph]],EdgeStyle->LightGray,GraphLayout->"LayeredDigraphEmbedding",VertexSize->.8,ImageSize->60];g
In[]:=
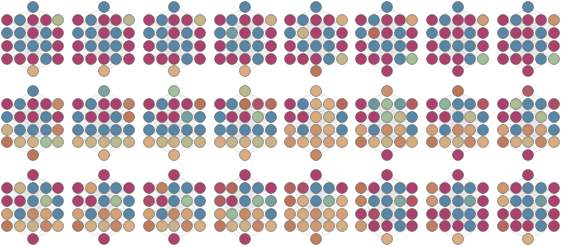
Table[NetGraphPlotX[experiment,{x},"AddArrows"->True],{x,-3,3,.5}]
Out[]=
,

,

,

,

,

,

,

,

,

,

,

,


In[]:=
Table[NetGraphPlotX[experiment,{x},"AddArrows"->True],{x,-3,3,.25}]
Out[]=
,
,

,
,

,
,

,
,

,
,

,
,

,
,

,
,

,
,

,
,

,
,

,
,

In[]:=
Length[%]
Out[]=
25
In[]:=
GraphicsGrid[Partition[Table[NetGraphPlotX[experiment,{x},"AddArrows"->True],{x,-3,3,.25}],8]]
Out[]=
Length[%]
In[]:=
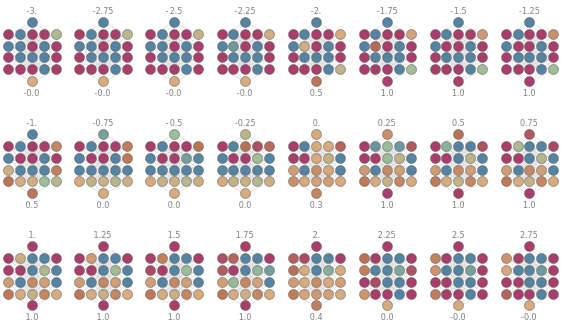
GraphicsGrid[Partition[Table[Column[{Style[Text[x],Gray,8],NetGraphPlotX[experiment,{x}],Style[Text[NumberForm[experiment[x],{1,1}]],Gray,8]},Center,Spacings->0],{x,-3,3,.25}],8]]
Out[]=
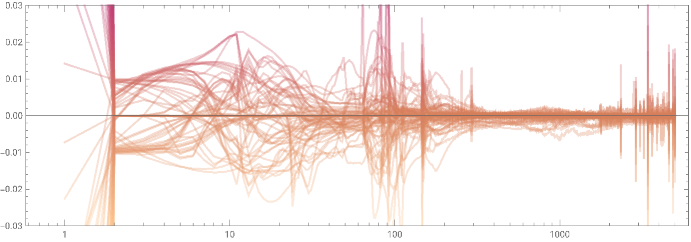
Differences/@Transpose[allwts]
In[]:=
ListLinePlot[Differences/@Transpose[allwts],AspectRatio->1/3,Frame->True,ScalingFunctions->{"Log","Linear"},PlotRange->{-.03,.03},PlotStyle->Opacity[.3],ColorFunction->(colorFun[#2]&)]
Out[]=
In[]:=
netRR["TrainedNet"]
Out[]=
NetChain
In[]:=
Information[%,"Properties"]
Out[]=
{Arrays,ArraysByteCounts,ArraysCount,ArraysDimensions,ArraysElementCounts,ArraysLearningRateMultipliers,ArraysList,ArraysPositionList,ArraysSizes,ArraysTotalByteCount,ArraysTotalElementCount,ArraysTotalSize,FullSummaryGraphic,InputForm,InputPortNames,InputPorts,Layers,LayersCount,LayersGraph,LayersList,LayerTypeCounts,MXNetNodeGraph,MXNetNodeGraphPlot,OutputPortNames,OutputPorts,Properties,RecurrentStatesCount,RecurrentStatesPositionList,SharedArraysCount,SummaryGraphic,TopologyHash}
In[]:=
Information[%216,"ArraysElementCounts"]
Out[]=
{1,Biases}5,{1,Weights}5,{3,Biases}5,{3,Weights}25,{5,Biases}5,{5,Weights}25,{7,Biases}5,{7,Weights}25,{9,Biases}1,{9,Weights}5
In[]:=
Values[%]
Out[]=
{5,5,5,25,5,25,5,25,1,5}
In[]:=
Total[%]
Out[]=
106
In[]:=
sizedResults=Table[TrainDiamondNet[createDiamondNet[n],trainingData,10,MaxTrainingRounds->1000,BatchSize->2000,TargetDevice->"GPU"],{n,2,6,2}];