In[]:=
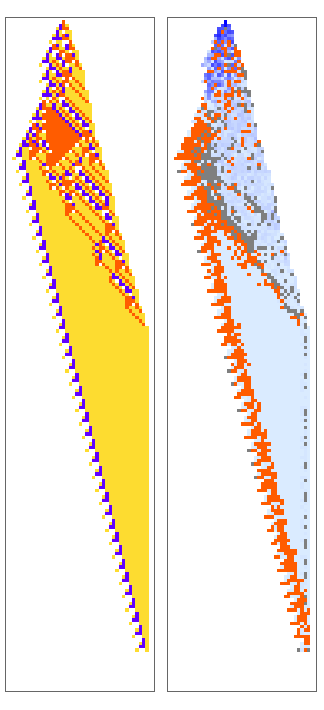
GraphicsRow@{PlotCA[getca[#[[1]],200]],PerturbationSensitivityPlot[{getca[#[[1]],200],#[[1]]}]}&@k4rob[[sirob[[15]]]]
Out[]=

In[]:=
Options[PlotSensitivities] = {ColorFunctionScaling->False, ColorFunction->(If[#==-1,Gray,If[#==1,Darker[Red],Blend[{LightBlue,Blue}, #]]]&),"IndexFunction"->getbodyidxs, "BackgroundColor"->White};PlotSensitivities[ca_, sensitivities_, ops:OptionsPattern[]]:= Module[{allops},allops=Merge[{Options[PlotSensitivities],ops},Last];idxs = Flatten[allops["IndexFunction"][ca], 1];calts = ReplacePart[ca,Thread[#1->#2&[idxs, sensitivities]]];PlotCA[calts, ColorFunctionScaling->allops[ColorFunctionScaling],(*ColorRules->{-1->allops[ColorFunction][0], 0->allops["BackgroundColor"]}, *)Sequence@@Normal[allops]]]
In[]:=
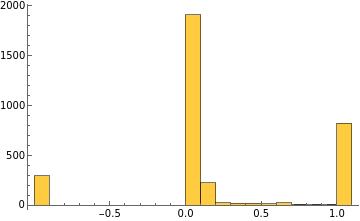
PerturbationSensitivities[{getca[#[[1]],200],#[[1]]}]&@k4rob[[sirob[[15]]]]
In[]:=
Histogram[%274]
Out[]=
In[]:=
GraphicsRow@{PlotCA[getca[#[[1]],200]],PerturbationSensitivityPlot[{getca[#[[1]],200],#[[1]]}]}&@k4rob[[sirob[[15]]]]
Out[]=
In[]:=
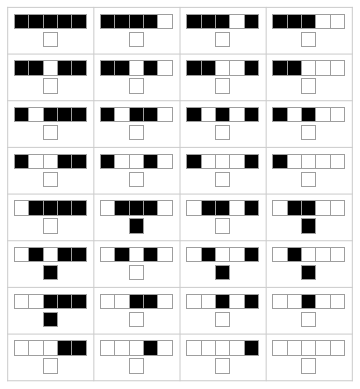
RulePlot[CellularAutomaton[{23424,2,2}]]
Out[]=