Ellipsoid Mesh

Ellipsoid

makeEllipsoidCode[a_,b_,c_,resolution_]:=StringTemplate[​​"cd(\"`6`\")\n"<>​​"fd=@(p) p(:, 1).^2 / `1`^2 + p(:, 2).^2 / `2`^2 + p(:, 3).^2 / `3`^2 - 1;\n"<>​​"[p, t] = distmeshsurface(fd, @huniform, `4`, [-1.1 * `1`, -1.1 * `2`, -1.1 * `3`; 1.1 * `1`, 1.1 * `2`, 1.1 * `3`]);\n"<>​​"writematrix(p, \"`5`/points.txt\");\n"<>​​"writematrix(t, \"`5`/triangles.txt\");"][a,b,c,resolution,$TemporaryDirectory,FileNameJoin[{$Dropbox,"Physics/CodeDevelopment/ExternalCode/distmesh"}]]
In[]:=
makeEllipsoidCode[1,3,3,0.1]
In[]:=
cd("/Users/maxitg/Dropbox (Wolfram)/Physics/CodeDevelopment/ExternalCode/distmesh")fd=@(p) p(:, 1).^2 / 1^2 + p(:, 2).^2 / 3^2 + p(:, 3).^2 / 3^2 - 1;[p, t] = distmeshsurface(fd, @huniform, 0.1, [-1.1 * 1, -1.1 * 3, -1.1 * 3; 1.1 * 1, 1.1 * 3, 1.1 * 3]);writematrix(p, "/private/var/folders/pz/q1ty3f9x1yq5f2ppwrkhgz4r0000gn/T/points.txt");writematrix(t, "/private/var/folders/pz/q1ty3f9x1yq5f2ppwrkhgz4r0000gn/T/triangles.txt");
Out[]=
getEllipsoid[]:=With[{points=Import[FileNameJoin[{$TemporaryDirectory,"points.txt"}],"CSV"],triangles=Import[FileNameJoin[{$TemporaryDirectory,"triangles.txt"}],"CSV"]},With[{simpleGraph=SimpleGraph[UndirectedEdge@@@Catenate[Partition[#,2,1,-1]&/@triangles]]},Graph3D[simpleGraph,VertexCoordinatespoints〚VertexList[simpleGraph]〛]]]
In[]:=
ellipsoid113=getEllipsoid[];
In[]:=
sphere=
Graph[
]
;
In[]:=
ellipsoid123=
Graph[
]
;
In[]:=
ellipsoid113=
Graph[
]
;
In[]:=

Ricci Scalar

ricciScalar[graph_]:=With{volumes=GraphNeighborhoodVolumes[graph]},
6(2+2)
2
Range[Length[#]-1]
1-
Rest[#]
π
2
Range[Length[#]-1]
&/@(Take[#,Min[Length/@volumes]]&)/@volumes
In[]:=
2
2
(GraphDiameter[sphere]/π)
//N
In[]:=
0.0152309
Out[]=
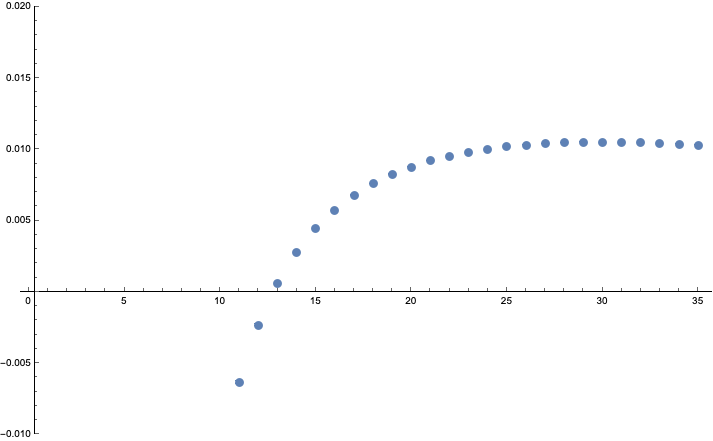
ricciScalarPlot[graph_,opts___]:=ListPlot[MeanAround/@Transpose[Values[ricciScalar[graph]]],opts]
In[]:=
ricciScalarPlot[sphere,PlotRange{All,{-0.01,0.02}}]
In[]:=
Out[]=
2
2
(GraphDiameter[ellipsoid113]/π)
//N
In[]:=
0.00360468
Out[]=
2
2
(GraphDiameter[ellipsoid113]/3/π)
//N
In[]:=
0.0324421
Out[]=
ricciScalarEllipsoid=N[ricciScalar[ellipsoid113]];
In[]:=
ricciScalarSphere=N[ricciScalar[sphere]];
In[]:=
Take[ReverseSort[Max/@ricciScalarEllipsoid],10]
In[]:=
300.0475295,270.0412991,220.0411476,210.0392825,10.037806,190.0366416,290.0354772,280.0354772,200.0348024,150.0343129
Out[]=
ListPlot[ricciScalarEllipsoid[30],JoinedTrue,PlotRange{All,{-0.01,All}}]
In[]:=
Out[]=
Take[Sort[ricciScalarEllipsoid〚All,10〛],10]
In[]:=
3365-0.0396034,3541-0.0396034,616-0.0388395,1106-0.0388395,923-0.0380755,3373-0.0380755,3616-0.0380755,3914-0.0380755,704-0.0373116,1295-0.0373116
Out[]=
VertexCount[ellipsoid113]
In[]:=
4310
Out[]=
Normal[Sort[ricciScalarEllipsoid〚All,10〛]]〚4310/2〛
In[]:=
1852-0.0205048
Out[]=
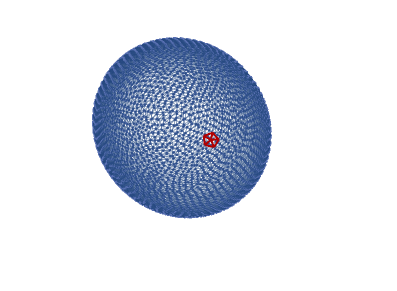
The position on the ellipsoid with the largest curvature
HighlightGraph[ellipsoid113,NeighborhoodGraph[ellipsoid113,30,1],GraphHighlightStyle"Thick"]
In[]:=
Out[]=
The smallest curvature
HighlightGraph[ellipsoid113,NeighborhoodGraph[ellipsoid113,3365,1],GraphHighlightStyle"Thick"]
In[]:=
Out[]=
In the middle
HighlightGraph[ellipsoid113,NeighborhoodGraph[ellipsoid113,1852,1],GraphHighlightStyle"Thick"]
In[]:=
Options[GraphFunctionPlot]=Join[{PlotRangeAutomatic},Options[GraphPlot]];​​GraphFunctionPlot[graph_Graph,vertexValue_Association,func_:GraphPlot,o:OptionsPattern[]]:=With{plotRange=Replace[OptionValue[PlotRange],AutomaticMinMax[vertexValue]]},WithvertexValues=
#-plotRange〚1〛
plotRange〚2〛-plotRange〚1〛
&/@vertexValue,func[graph,VertexStyleNormal[ColorData["RedBlueTones"]/@vertexValues],EdgeStyleColorData["RedBlueTones"]/@(Mean[vertexValues/@List@@#]&)/@EdgeList[graph],FilterRules[FilterRules[{o},Options[GraphPlot]],Except[PlotRange]]]
In[]:=
MinMax[ricciScalarEllipsoid〚All,10〛]
In[]:=
{-0.0396034,0.0398467}
Out[]=
GraphFunctionPlot[ellipsoid113,ricciScalarEllipsoid〚All,10〛,GraphPlot3D,PlotRange->{-0.03960340402384174`,0.039846743567632396`}]
In[]:=
Out[]=
GraphFunctionPlot[sphere,ricciScalarSphere〚All,10〛,GraphPlot3D,PlotRange->{-0.03960340402384174`,0.039846743567632396`}]
In[]:=
Out[]=

Orthogonal Directions

RankedGeodesics[ellipsoid113,5]
In[]:=
Out[]=
direction1={1745,2292};direction2={1991,2277};
In[]:=
HighlightGraph[ellipsoid113,{Subgraph[ellipsoid113,FindShortestPath[ellipsoid113,##]&@@direction1],Subgraph[ellipsoid113,FindShortestPath[ellipsoid113,##]&@@direction2]}]
In[]:=
Out[]=

Geodesic Bundles in orthogonal directions [old]

GeodesicsBundle[ellipsoid113,direction1]
In[]:=
$Aborted
Out[]=
GeodesicsBundle[ellipsoid113,direction2]
Out[]=

Cylinder growth [old]

tubeVolume[graph_,v1_,v2_,r_]:=VertexCount@NeighborhoodGraph[graph,FindShortestPath[graph,v1,v2],r]
In[]:=
tube1Growth=Table[tubeVolume[ellipsoid123,753,817,r],{r,0,5}];
In[]:=
tube2Growth=Table[tubeVolume[ellipsoid123,366,982,r],{r,0,5}];
In[]:=
ListPlot[{tube1Growth,tube2Growth},PlotLegends{1,2}]
In[]:=
Out[]=

Longer tubes [old]

geodesics10=RankedGeodesics[ellipsoid123,10];
In[]:=
Position[geodesics10,1237]
In[]:=
{{46,2,1,2},{50,2,1,2},{51,2,1,2},{55,2,1,2},{60,2,1,2},{66,2,1,2},{75,2,1,2},{84,2,1,2},{94,2,1,2},{95,2,1,2},{102,2,1,2}}
Out[]=
geodesics10〚Position[geodesics10,1237]〚All,1〛〛
In[]:=
Out[]=
path1={182,1237};
In[]:=
geodesics10Horizontal=RankedGeodesics[ellipsoid123,10,{182,684,1237}];
In[]:=
geodesics10Horizontal〚{1,-32}〛
In[]:=
Out[]=
tube1Growth=Table[tubeVolume[ellipsoid123,182,1237,r],{r,0,10}];
In[]:=
tube2Growth=Table[tubeVolume[ellipsoid123,580,764,r],{r,0,10}];
In[]:=
ListPlot[{tube1Growth,tube2Growth},PlotLegends{1,2}]
In[]:=
Out[]=

Ball growth

DimensionEstimateList[g_Graph,v_]:=ResourceFunction["LogDifferences"][N[First[Values[GraphNeighborhoodVolumes[g,{v}]]]]]
In[]:=
VolumeList[g_Graph,v_]:=N[First[Values[GraphNeighborhoodVolumes[g,{v}]]]]
In[]:=
DimensionEstimateList[ellipsoid113,30]
In[]:=
{2.58496,2.41902,2.29906,2.23102,2.18793,2.15832,2.02975,2.05187,1.97745,1.92896,1.9334,1.9028,1.84849,1.80797,1.80664,1.72226,1.70821,1.64513,1.64328,1.64261,1.64286,1.73691,1.70661,1.65872,1.63837,1.68359,1.64273,1.60647,1.57409,1.52568,1.50062,1.4966,1.47473,1.45471,1.4363,1.38362,1.3873,1.35595,1.37859,1.36582,1.37096,1.32521,1.29855,1.30662,1.28125,1.29007,1.26581,1.24255,1.28531,1.26191,1.20718,1.26665,1.11645,1.09808,1.09614,1.07834,1.07687,1.09136,1.01024,1.01007,0.946275,0.899277,0.884733,0.822267,0.792366,0.730317,0.733247,0.622125,0.543541,0.480996,0.351182,0.253286,0.153638}
Out[]=
Show[ListLinePlot[Table[DimensionEstimateList[ellipsoid113,v],{v,{30,3365}}],FrameTrue],Plot[2,{r,0,50},PlotStyleDotted]]
In[]:=
Out[]=
HighlightGraph[Graph[ellipsoid113,EdgeStyleLightGray,VertexStyleLightGray],{Style[NeighborhoodGraph[ellipsoid113,30,4],ColorData[97,1]],Style[NeighborhoodGraph[ellipsoid113,3365,4],ColorData[97,2]]}]
In[]:=
Out[]=
FindShortestPath[ellipsoid113,30,3365]
In[]:=
{30,37,38,80,85,138,144,186,251,257,312,384,385,451,518,598,666,667,735,820,897,984,1054,1137,1138,1222,1313,1391,1483,1561,1634,1710,1792,1873,1949,2025,2101,2177,2253,2329,2405,2481,2562,2561,2643,2721,2797,2873,3041,3038,3123,3210,3291,3365}
Out[]=
HighlightGraph[Graph[ellipsoid113],{Style[NeighborhoodGraph[ellipsoid113,385,10],Directive[Red,Thick]],Style[NeighborhoodGraph[ellipsoid113,3041,10],Directive[Red,Thick]]}]
In[]:=
Out[]=
GraphPlot3D[HighlightGraph[Graph[ellipsoid113],{Style[NeighborhoodGraph[ellipsoid113,385,#],Directive[Red,Thick]],Style[NeighborhoodGraph[ellipsoid113,3041,#],Directive[Red,Thick]]}],ViewPoint{-1.4999984076361856`,2.900242374364533`,0.8880309381036673`},ViewVertical{-0.36545920420294903`,0.6610581921482263`,0.6553179660722467`},BaseStyle{Graphics3DBoxOptions{Method{"ShrinkWrap"True}}},ImageSize{130,Automatic}]&/@{7,12,17}
Out[]=
HighlightGraph[Graph[ellipsoid113],{Style[NeighborhoodGraph[ellipsoid113,385,15],Directive[Red,Thick]],Style[NeighborhoodGraph[ellipsoid113,3041,15],Directive[Red,Thick]]}]
In[]:=
Out[]=
With[{u=VolumeList[ellipsoid113,#]&/@{144,3365}},ListLinePlot[Transpose[{Range[Length[#]]-1,#}]&/@u,MeshAll,FrameTrue,PlotRange{0,Max[u]+1}]]
In[]:=
Out[]=