Areal-Euclidean Equivalency
Explanation
Explanation
In areal coordinates, a point has coordinates in terms of a simplex. The sum of coordinates is 1.
It’s often handy to convert to integers, {1/6,1/3,1/2} going to {1,2,3} and then dividing by the total before usage.
Some distance functions. The first is equivalent to euclidean distance:
DotDistance[u_,v_]:=Sqrt[u.u+v.v-2u.v];DotDistance2[u_,v_]:=u.u+v.v-2u.v;
In[]:=
Here are a 2D equilateral triangle and a 3D regular tetrahedron usable as simplices:
tri=-,-,0,,,-;
1
2
1
6
2
3
1
2
1
6
In[]:=
tet={{-1,-1,1},{-1,1,-1},{1,-1,-1},{1,1,1}}/2;
In[]:=
Both simplices are chosen so that edgelengths are all :
2
DotDistance@@#&/@Subsets[tri,{2}]
2
,2
,2
DotDistance@@#&/@Subsets[tet,{2}]
2
,2
,2
,2
,2
,2
A function to go back and forth between areal coordinates and euclidean coordinates:
Areal[simplex_,point_]:=Module[{dim,var},dim=Dimensions[simplex];If[dim[[1]]Length[point]&&Chop[N[Total[point]-1]]0,(*ConvertfromAreal*)point.#&/@Transpose[simplex],(*ConverttoAreal*)var=Table[Subscript[x,a],{a,1,dim[[1]]}];var/.Solve[{var.#&/@Transpose[simplex]point,Total[var]1}][[1]]]];
In[]:=
Areal point is on areal line if their dot product equals 0. A canonical areal line can have three forms:
• with total 1.
• with total 0, going through the center point (1/3, 1/3, 1/3).
•, the vertical line through the center point.
{a,b,c}
{A,B,C}
Aa+Bb+Cc
•
{a,b,c}
•
{a,-1-a,1}
•
{1,-1,0}
A way to make the lines (fix this to work generally):
BaryLiner[{pt1_,pt2_}]:=Module[{a,b},If[Det[{pt1,pt2,{1,1,1}/3}]≠0,{a,b,1-a-b}/.Solve[{a,b,1-a-b}.#0&/@{pt1,pt2}][[1]],If[pt1[[1]]≠pt1[[2]],{a,-1-a,1}/.Solve[{a,-1-a,1}.#0&/@{pt1,pt2}][[1]],{1,-1,0}]]];
lineintersect[{{a1_,b1_,c1_},{a2_,b2_,c2_}}]:=With[{init={b1c2-b2c1,a2c1-a1c2,a1b2-a2b1}},If[Total[init]0,init,init/Total[init]]];
Three noncollinear points in three dimensions determine a unique plane with an equation of the form , where ++1 and is the positive distance of the plane from the origin. The vector is normal (perpendicular) to the plane and has norm (length) equal to 1. For such an equation, the signed distance from a point to the plane is given by . Points on the same side of the plane have the same sign.
Ax+By+Cz=D
2
A
2
B
2
C
D
(A,B,C)
(x,y,z)
(A,B,C,D)·(x,y,z,-1)
findPlaneEquation[{{x1_,y1_,z1_},{x2_,y2_,z2_},{x3_,y3_,z3_}}]:=Module[{pts,rowreduce,lastrr},pts=SortBy[{{x1,y1,z1},{x2,y2,z2},{x3,y3,z3}},N[#]&];If[Length[Union[pts]]1,(*point*)Return[pts]];rowreduce=RowReduce[Append[#,1]&/@pts];lastrr=Abs[Sign[Last[rowreduce]]];If[Total[lastrr]0,(*line*)Return[Drop[pts,{2}]],If[Total[Take[lastrr,3]]0,(*planethroughorigin*)Return[RootReduce[Append[#/Norm[#]&@(Last[SortBy[{a,b,c}/.Solve[Append[{a,b,c}.#0&/@pts,a^2+b^2+c^21]],Sign[#]&]]),0]]],(*planenotonorigin*)Return[-RootReduce[(#/Norm[Take[#,3]]&@Append[(Last/@rowreduce),-1])]]]]];
Bring in normed lines.
Liner[{pt1_,pt2_}]:=Det[{{x,y,1},{First[pt1],Last[pt1],1},{First[pt2],Last[pt2],1}}]
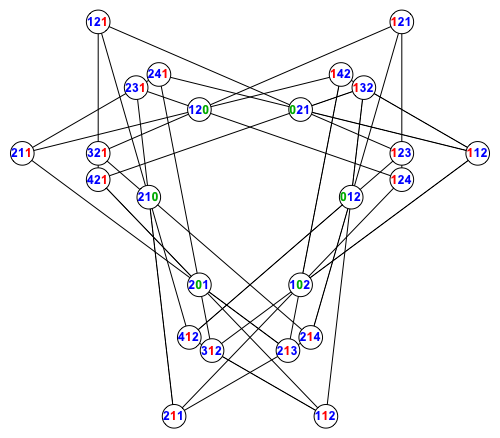
Here’s a set of 24 areal points on 24 areal lines (hover over to see).
set={{-1,1,2},{-1,2,1},{-1,2,3},{-1,2,4},{-1,3,2},{-1,4,2},{0,1,2},{0,2,1}};full=Flatten[{set,RotateLeft/@set,RotateRight/@set},1];Graphics[{EdgeForm[Black],Tooltip[Line[#[[2]]],Style[Row[Switch[Sign[#],-1,Style[ToString[Abs[#]],Red],0,Style[ToString[Abs[#]],Darker[Green]],1,Style[ToString[Abs[#]],Blue]]&/@#[[1]]],14,Bold]]&/@Table[{full[[k]],Sort[Areal[tri,#/Total[#]]&/@Select[full,full[[k]].#0&]]},{k,1,Length[full]}],White,{Disk[Areal[tri,#/Total[#]],.055],Black,Style[Text[Row[Switch[Sign[#],-1,Style[ToString[Abs[#]],Red],0,Style[ToString[Abs[#]],Darker[Green]],1,Style[ToString[Abs[#]],Blue]]&/@#],Areal[tri,#/Total[#]]],12,Bold]}&/@full},ImageSize500]
Here’s a set of 27 areal points on 27 areal lines (hover over to see).
set={{-2,-1,4},{-2,1,3},{-1,1,1},{-1,2,0},{-1,2,1},{-1,3,2},{-1,4,2},{0,1,2},{1,1,2}};full=Flatten[{set,RotateLeft/@set,RotateRight/@set},1];Graphics[{EdgeForm[Black],Tooltip[Line[#[[2]]],Style[Row[Switch[Sign[#],-1,Style[ToString[Abs[#]],Red],0,Style[ToString[Abs[#]],Darker[Green]],1,Style[ToString[Abs[#]],Blue]]&/@#[[1]]],14,Bold]]&/@Table[{full[[k]],Sort[Areal[tri,#/Total[#]]&/@Select[full,full[[k]].#0&]]},{k,1,Length[full]}],White,{Disk[Areal[tri,#/Total[#]],.08],Black,Style[Text[Row[Switch[Sign[#],-1,Style[ToString[Abs[#]],Red],0,Style[ToString[Abs[#]],Darker[Green]],1,Style[ToString[Abs[#]],Blue]]&/@#],Areal[tri,#/Total[#]]],9,Bold]}&/@full},ImageSize800]
Here’s a bunch of regular tetrahedra and equilateral triangles in areal coordinates:
arealtetras=;arealtris=Drop[#,{3}]&/@Take[#,3]&/@arealtetras;
For the particular chosen simplex tet={{-1,-1,1},{-1,1,-1},{1,-1,-1},{1,1,1}}/2, using the distance function on the areal coordinates gives the same value as the distance function on the cartesian coordinates.
arealcoords=-1,-,0,,-,0,0,,-,,0,,-,-,,;
5
6
17
6
1
2
3
2
11
6
1
2
7
3
3
2
1
2
7
6
11
6
coords=Areal[tet,#]&/@arealcoords
,,,1,1,,,,0,,,-
7
3
3
2
4
3
1
2
11
6
7
3
5
2
5
6
1
6
DotDistance2@@#&/@Subsets[coords,{2}]
,,,,,
49
18
49
18
49
18
49
18
49
18
49
18
DotDistance2@@#&/@Subsets[arealcoords,{2}]
,,,,,
49
18
49
18
49
18
49
18
49
18
49
18
More examples showing that the areal distance is the same as the euclidean distance:
Table[{Union[DotDistance2@@#&/@Subsets[arealtetras[[k]],{2}]],Union[DotDistance2@@#&/@Subsets[Areal[tet,#]&/@arealtetras[[k]],{2}]]},{k,1,50}]
Also in the triangles, the areal distance is the same as the euclidean distance:
Table[{Union[DotDistance2@@#&/@Subsets[arealtris[[k]],{2}]],Union[DotDistance2@@#&/@Subsets[RootReduce[Areal[tri,#]&/@arealtris[[k]]],{2}]]},{k,1,50}]
case=RootReduce[Areal[tri,#]&/@arealtris[[1]]];RootReduce[Table[DotDistance@@{case[[k]],Mean[Drop[case,{k}]]},{k,1,3}]]
,,
7
2
3
5
7
2
3
5
7
2
3
5
case=RootReduce[Areal[tri,#]&/@arealtris[[2]]];RootReduce[Table[DotDistance@@{case[[k]],Mean[Drop[case,{k}]]},{k,1,3}]]
,,
7
2
6
7
2
6
7
2
6
Making Levi Graphs
Making Levi Graphs
Levi graphs have vertices that are both lines and points.
If a point is on a line, they are connected by an edge.
The Fano plane is 7 points and 7 lines
FanoPlane=Select[Subsets[Range[7],{3}],BitXor@@#0&]
{{1,2,3},{1,4,5},{1,6,7},{2,4,6},{2,5,7},{3,4,7},{3,5,6}}
The Levi graph of the Fano plane is the Heawood graph:
GraphData["HeawoodGraph"]
IsomorphicGraphQ[Graph[UndirectedEdge@@@Flatten[Table[{k,#}&/@Select[FanoPlane,MemberQ[#,k]&],{k,1,7}],1]],GraphData["HeawoodGraph"]]
True
GraphicsRow[{GraphData["CremonaRichmondConfigurationGraph"],GraphData["LeviGraph"]}]
Another configuration and graph
set={{-1,1,2},{-1,2,1},{-1,2,3},{-1,2,4},{-1,3,2},{-1,4,2},{0,1,2},{0,2,1}};full=Flatten[{set,RotateLeft/@set,RotateRight/@set},1];GraphicsRow[{Graphics[{EdgeForm[Black],Tooltip[Line[#[[2]]],Style[Row[Switch[Sign[#],-1,Style[ToString[Abs[#]],Red],0,Style[ToString[Abs[#]],Darker[Green]],1,Style[ToString[Abs[#]],Blue]]&/@#[[1]]],14,Bold]]&/@Table[{full[[k]],Sort[Areal[tri,#/Total[#]]&/@Select[full,full[[k]].#0&]]},{k,1,Length[full]}],White,{Disk[Areal[tri,#/Total[#]],.055],Black,Style[Text[Row[Switch[Sign[#],-1,Style[ToString[Abs[#]],Red],0,Style[ToString[Abs[#]],Darker[Green]],1,Style[ToString[Abs[#]],Blue]]&/@#],Areal[tri,#/Total[#]]],12,Bold]}&/@full},ImageSize500],SimpleGraph[Graph[UndirectedEdge@@@Flatten[Table[{Append[full[[k]],1],#}&/@Select[full,full[[k]].#0&],{k,1,24}],1]]]}]
A 96_6 Configuration and graph
In[]:=
Out[]=
GraphNeighborhoodVolumes
In[]:=
Out[]=
RaggedMeanAround[Values[%206]]
In[]:=
{1,7,37,108.00±0.07,173.00±0.07,192}
Out[]=
Ratios[%]
In[]:=
7,,2.9189±0.0020,1.6019±0.0013,1.1098±0.0005
37
7
Out[]=
Junk
Junk
Table[With[{pp=arealtris[[1,k]],ll=BaryLiner[Drop[arealtris[[1]],{k}]],case=RootReduce[Areal[tri,#]&/@arealtris[[1]]]},With[{dist=RootReduce[Table[DotDistance@@{case[[k]],Mean[Drop[case,{k}]]},{k,1,3}]][[1]],warp=BaryLiner[{pp,ll}]},{dist,Dot@@{pp,ll},Norm/@{pp,ll,(pp+ll)},Dot@@{pp,ll}/distDenominator[Norm[ll]]}]],{k,1,3}]
,-,,,,-35,,,,,,14,-,,,,-14
7
2
3
5
49
153
5
7
2
3
6427
6
51
74078
3
51
7
2
3
5
196
1485
1579
2
15
10193
3
99
6056323
6
495
2
,7
2
3
5
196
285
1313
6
5
251
19
145721
2
95
2
3
With[{m=1},Table[With[{pp=arealtris[[m,k]],ll=BaryLiner[Drop[arealtris[[m]],{k}]],case=RootReduce[Areal[tri,#]&/@arealtris[[m]]]},With[{dist=RootReduce[Table[DotDistance@@{case[[k]],Mean[Drop[case,{k}]]},{k,1,3}]][[1]],warp=BaryLiner[{pp,ll}],pc=case[[k]]},{dist,Dot@@{pp,ll},Norm/@{pp,ll,pc},Dot@@{pp,ll}/distDenominator[Norm[ll]]}]],{k,1,3}]]
,-,,,,-35,,,,,,14,-,,,,-14
7
2
3
5
49
153
5
7
2
3
6427
6
51
13
3
2
7
2
3
5
196
1485
1579
2
15
10193
3
99
1429
2
15
2
,7
2
3
5
196
285
1313
6
5
251
19
421
2
5
2
3
With[{m=2},Table[With[{pp=arealtris[[m,k]],ll=BaryLiner[Drop[arealtris[[m]],{k}]],case=RootReduce[Areal[tri,#]&/@arealtris[[m]]]},With[{dist=RootReduce[Table[DotDistance@@{case[[k]],Mean[Drop[case,{k}]]},{k,1,3}]][[1]],warp=BaryLiner[{pp,ll}],pc=case[[k]]},{dist,Dot@@{pp,ll},Norm/@{pp,ll,pc},Dot@@{pp,ll}/distDenominator[Norm[ll]]}]],{k,1,3}]]
,-,,,,-14,,,,,,14,-,,,,-14
7
2
6
49
93
5
7
2
3
451
31
13
3
2
2
3
7
2
6
49
297
5
2
10193
3
99
13
6
2
,7
2
6
49
57
163
2
3
251
19
157
2
3
2
3
With[{m=150},Table[With[{pp=arealtris[[m,k]],ll=BaryLiner[Drop[arealtris[[m]],{k}]],case=RootReduce[Areal[tri,#]&/@arealtris[[m]]]},With[{dist=RootReduce[Table[DotDistance@@{case[[k]],Mean[Drop[case,{k}]]},{k,1,3}]][[1]],warp=BaryLiner[{pp,ll}],pc=case[[k]]},{dist,Dot@@{pp,ll},Norm/@{pp,ll,pc},Dot@@{pp,ll}/distDenominator[Norm[ll]]}]],{k,1,3}]]
,-,,,-2,,,,,,4,,,,,,
13
4
6
13
6
193
2
6
3
,13
6
2
2
3
13
4
6
13
21
19
2
3
3
3
7
13
2
3
2
3
13
4
6
13
24
7
2
2
1
2
13
6
2
1
3
With[{m=300},Table[With[{pp=arealtris[[m,k]],ll=BaryLiner[Drop[arealtris[[m]],{k}]],case=RootReduce[Areal[tri,#]&/@arealtris[[m]]]},With[{dist=RootReduce[Table[DotDistance@@{case[[k]],Mean[Drop[case,{k}]]},{k,1,3}]][[1]],warp=BaryLiner[{pp,ll}],pc=case[[k]]},{dist,Dot@@{pp,ll},Norm/@{pp,ll,pc},Dot@@{pp,ll}/distDenominator[Norm[ll]]}]],{k,1,3}]]
,,,,,35,,,,,,70,,-,,,,-35
7
10
6
49
402
9
5
2
3
257
67
193
6
5
2
3
7
10
6
49
327
377
15
3
803
109
302
15
2
3
7
10
6
49
582
1057
2
15
3953
97
907
2
15
2
3
With{m=300},TableWith{pp=arealtris[[m,k]],ll=BaryLiner[Drop[arealtris[[m]],{k}]],case=RootReduce[Areal[tri,#]&/@arealtris[[m]]]},With{dist=RootReduce[Table[DotDistance@@{case[[k]],Mean[Drop[case,{k}]]},{k,1,3}]][[1]],warp=BaryLiner[{pp,ll}],pc=case[[k]]},dist,Dot@@{pp,ll},Norm/@{pp,ll,pc},RootReduce
3
Dot@@{pp,ll}distDenominator[Norm[ll]]Sqrt[Abs[Numerator[Dot@@{pp,ll}]]]Denominator[Norm[pp]],{k,1,3},,,,,1,,,,,,,,-,,,,-
7
10
6
49
402
9
5
2
3
257
67
193
6
5
7
10
6
49
327
377
15
3
803
109
302
15
2
2
3
7
10
6
49
582
1057
2
15
3953
97
907
2
15
1
3
With{m=1},TableWith{pp=arealtris[[m,k]],ll=BaryLiner[Drop[arealtris[[m]],{k}]],case=RootReduce[Areal[tri,#]&/@arealtris[[m]]]},With{dist=RootReduce[Table[DotDistance@@{case[[k]],Mean[Drop[case,{k}]]},{k,1,3}]][[1]],warp=BaryLiner[{pp,ll}],pc=case[[k]]},dist,Dot@@{pp,ll},RootReduce
3
Dot@@{pp,ll}distDenominator[Norm[ll]]Sqrt[Abs[Numerator[Dot@@{pp,ll}]]]Denominator[Norm[pp]],{k,1,3},-,-,,,,,-,-
7
2
3
5
49
153
5
6
7
2
3
5
196
1485
1
5
3
7
2
3
5
196
285
1
5
3
RootReduce[Areal[tri,Mean[Drop[case,{k}]]]]
With[{m=4},Table[With[{pp=arealtris[[m,k]],ll=BaryLiner[Drop[arealtris[[m]],{k}]],case=RootReduce[Areal[tri,#]&/@arealtris[[m]]],mida=Mean[Drop[arealtris[[m]],{k}]]},With[{dist=RootReduce[Table[DotDistance@@{case[[k]],Mean[Drop[case,{k}]]},{k,1,3}]][[1]],warp=BaryLiner[{pp,ll}],pc=case[[k]],mid=RootReduce[Areal[tri,Mean[Drop[case,{k}]]]]},{Dot@@{pp,ll},pp,ll,dist^2,mid,mida,DotDistance@@{pp,mid},dist}]],{k,1,3}]]