In[]:=
WolframModel[{{0,1},{0,2},{0,3}}{{1,2},{2,3},{3,4},{4,1},{4,3}},Table[0,3,2],20]
Out[]=

In[]:=
%53["EventsCount"]
Out[]=
525
In[]:=
WolframModel[{{0,1},{0,2},{0,3}}{{1,2},{2,3},{3,4},{4,1},{4,3}},Table[0,3,2],2]//First
Out[]=

In[]:=
WolframModel[{{0,1},{0,2},{0,3}}{{1,2},{2,3},{3,4},{4,1},{4,3}},Table[0,3,2],3]//First
Out[]=

GenerationEventsCountList
GenerationEventsCountList
In[]:=
gecl[eo_]:=Differences[eo[[1]][SetReplace`PackageScope`$creatorEvents][[Flatten[Position[Differences[eo[[1]][SetReplace`PackageScope`$generations]],1]]+1]]]
In[]:=
gecl[WolframModel[{{0,1},{0,2},{0,3}}{{1,2},{2,3},{3,4},{4,1},{4,3}},Table[0,3,2],20]]
Out[]=
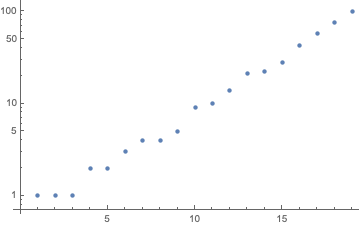
{1,1,1,2,2,3,4,4,5,9,10,14,21,22,28,43,57,75,99}
In[]:=
ListLogPlot[%]
Out[]=
In[]:=
Length/@WolframModel[{{0,1},{0,2},{0,3}}{{1,2},{2,3},{3,4},{4,1},{4,3}},Table[0,3,2],20]["StatesList"]
Out[]=
{3,5,7,9,13,17,23,31,39,49,67,87,115,157,201,257,343,457,607,805,1053}
In[]:=
Differences[%]
Out[]=
{2,2,2,4,4,6,8,8,10,18,20,28,42,44,56,86,114,150,198,248}
In[]:=
%/2
Out[]=
{1,1,1,2,2,3,4,4,5,9,10,14,21,22,28,43,57,75,99,124}
I.e. net creation of 2 hyperedges per generation
2 rules
2 rules
{{{{{1,2},{1,3}}{{1,4},{2,4},{4,3},{4,5}},{{1,2},{1,3}}{{1,3}}},{{0,0},{0,0}},9}}
In[]:=
WolframModel[{{{1,2},{1,3}}{{1,4},{2,4},{4,3},{4,5}},{{1,2},{1,3}}{{1,3}}},{{0,0},{0,0}},10]
Out[]=

In[]:=
gecl[%]
Out[]=
{1,2,4,6,9,15,22,34,53}
In[]:=
Differences[Length/@%70["StatesList"]]/2
Out[]=
{1,2,4,6,9,15,22,34,53,79}
In[]:=
With[{eo=WolframModel[#[[1]],#[[2]],10]},{#1,#2,#1-#2}&@@{gecl[eo],Most[Differences[Length/@eo["StatesList"]]/2]}]&/@{{{{{1,2},{2,3}}{{3,2},{4,1},{4,1},{4,3}},{{1,2},{2,1}}{{1,1}}},{{0,0},{0,0}},10},{{{{1,2},{3,2}}{{1,3},{4,2},{4,5},{5,3}},{{1,1},{1,2}}{{2,3}}},{{0,0},{0,0}},12},{{{{1,2},{1,3}}{{2,3},{2,4},{2,5},{4,1}},{{1,1},{1,2}}{{3,3}}},{{0,0},{0,0}},10},{{{{1,2},{2,3}}{{1,4},{3,2},{3,4},{5,2}},{{1,1},{1,1}}{{1,1}}},{{0,0},{0,0}},11},{{{{1,2},{2,3}}{{1,2},{2,4},{4,3},{4,5}},{{1,1},{1,1}}{{1,1}}},{{0,0},{0,0}},9},{{{{1,2},{2,3}}{{2,3},{2,4},{4,1},{5,3}},{{1,2},{2,3}}{{3,3}}},{{0,0},{0,0}},15}}
Out[]=

In[]:=
RandomWolframModelRule[{{{{2,2}}{{4,2}},8},{{{2,2}}{{1,2}},3}}]
Out[]=
In[]:=
Map[(#->With[{eo=Echo@WolframModel[#,{{0,0},{0,0}},10]},{#1,#2,#1-#2}&@@{gecl[eo],Most[Differences[Length/@eo["StatesList"]]/2]}])&,Table[RandomWolframModelRule@@@{{{{2,2}}{{4,2}},8},{{{2,2}}{{1,2}},3}},5]]
»
WolframModelEvolutionObject

»
WolframModelEvolutionObject
»
WolframModelEvolutionObject
»
WolframModelEvolutionObject
»
WolframModelEvolutionObject
Out[]=

In[]:=
Framed/@%
Out[]=
In[]:=
Table[RandomWolframModelRule@@@{{{{2,2}}{{4,2}},8},{{{2,2}}{{1,2}},3}},20]
Out[]=

Causal Graph
Causal Graph
This could be colored by generation.....
Color causal graph by generations .... [ relation to layered graphs?? ]
For minimal initial conditions, there is always a single first event..... and it’s numbered 1.
DistanceLayeredGraph
DistanceLayeredGraph
Generation Layered Graph
Generation Layered Graph