To run this code, first run MW-Time-Init.nb, then run everything in the next section. Then try the examples at the end. See description of options in DirectedNeighborsPicture::usage. This version doesn't yet implement ribbon-edges. Note that the example uses the Hyperbola view, which allows for straight lines between nodes at the same time level, and perhaps looks better for this reason.
DirectedNeighborsPicture code
DirectedNeighborsPicture code
DirectedNeighborsPicture[g_,init_,opts___?OptionQ]:=Module[{a,b,c,d,already,time,nodecoordinates,wts,maxt,weight,coords,psep,dip,hyperbola,reord,sym,ar,cone,nodesize,arrows,arrowlength,arrowangle,arrowlocation,up},{reord,sym,ar,cone,hyperbola,nodesize,dip,psep,arrows,arrowlength,arrowangle,arrowlocation}={Reordered,Symmetrized,AspectRatio,LightCone,Hyperbola,NodeSize,Dip,ParallelSeparation,Arrows,ArrowLength,ArrowAngle,ArrowLocation}/.{opts}/.Options[DirectedNeighborsPicture]; (*Thenodesattimetarecomputedandputintime[t].Thesearethenodeswhoseminimalforwarddistance fromtheinitialnode(orinitialnodes)ist.The{space,time}coordinatesofnodeiareputin nodecoordinates[i].IfReordered->True,thenodesatattimet(forfixedt>0)arespatiallyreorderedtotrytoreducehowmanyedges crossoneanother.Togettheorder,weassignweightstoeachoftheedgesattachingnodeitonodesatprevioustimes,addingtheweights,andorderingthenodesinorderofincreasingweights.Theweightforanedgeattachingnodeiattimettonodejattimet-kisequaltothespatialpositionofnodejdividedby(numberofnodesattimet-ktimesk).*) time[0]=init; already={}; maxt=0; weight[{node_,z_,numberofedges_}]:=Function[x,{(numberofedges*x〚1〛)/((Length[time[x〚2〛]]+1)*(maxt-x〚2〛)),numberofedges/(maxt-x〚2〛)}]@nodecoordinates[node]; While[time[maxt]≠{}, already=Union[already,time[maxt]]; MapIndexed[(nodecoordinates[#1]={First[#2],maxt})&,time[maxt]]; maxt++; time[maxt]=Complement[Flatten[(First/@Cases[#,_?((#〚2〛>0)&)])&/@(time[maxt-1]/.g)],already]; If[reord,wts=((#〚1〛/#〚2〛)&@(Plus@@weight/@Cases[#,_?(MemberQ[already,#〚1〛]&)]))&/@(time[maxt]/.g); time[maxt]=Last/@Sort[Transpose[{wts,time[maxt]}]]] ]; (*Givenapointinthecoordinatesusedabove(e.g.,giventhelocationofnodeiasnodecoordinates[i])theactualgraphicallocationofthepointdependsontheoptionsSymmetrized,LightConeandHyperbola.This routinecomputesthosecoordinates.Eachtimesliceiscenteredat0ifSymmetrized->True,andstartat0andgoestotheleftifnot.ThespacelikeslicesareonhyperbolasifHyperbola->Trueandonhorizontallinesifnot.Timemovesdown.ThisisthepictureifLightCone->True;ifnot,thewholepictureisrotated90degreescounterclockwise.*) coords[{x_,t_}]:=Module[{xx,tt}, xx=If[sym,x-.5*(Length[time[t]]+1),x-1]; tt=If[hyperbola,If[t==0,0,Sqrt[t^2+xx^2]],t]; If[cone,{xx,-tt},{tt,xx}]]; (*Nowitistimetodrawthenetwork.IfHyperbola->FalsethenthemodeledgebetweennodesonthesametimeslicedipsdownwardbytheparameterDip;otherwiseallmodeledgesarestraightlines(thoughiftherearemultipleedgesbetweenthesametwonodesthentheyvaryfromthemodeledgebyparameterParallelSeparation).Alledgesarequadraticcurves.*) Flatten[Table[{If[nodesize>0,Graphics[Disk[coords[nodecoordinates[g〚i,1〛]],nodesize],AspectRatio->ar],{}],Table[If[g〚i,1〛<g〚i,2,j,1〛,Table[QuadraticCurve[{a,b}=coords[nodecoordinates[g〚i,1〛]];{c,d}=coords[nodecoordinates[g〚i,2,j,1〛]];{{a,b},{If[cone||hyperbola||(a≠c),0,dip]+(a+c)*.5+psep(k-(g〚i,2,j,3〛+1)/2)(d-b),If[!cone||hyperbola||(b≠d),0,-dip]+(b+d)*.5+psep(k-(g〚i,2,j,3〛+1)/2)(a-c)},{c,d}},arrows,arrowlength,arrowangle,arrowlocation,ar,If[k>g〚i,2,j,2〛,False,True]],{k,g〚i,2,j,3〛}],{}],{j,Length[g〚i,2〛]}]},{i,Length[g]}]]]
DirectedNeighborsPicture::usage="DirectedNeighborsPicture[g,init,opts] produces a set of graphic objects which represent the causal network given in g. g is a list of items of the form 0->{{a1,a2,a3},{b1,b2,b3},...} where this means that: there are a2 edges going from node 0 to node a1 and a3-a2 edges going from node a1 to node 0; there are b2 edges going from node 0 to node b1 and b3-b2 edges going from node b1 to node 0; and so on. (This is the form of the output to SMWEvolveListNW.) init is a list containing nodes to put at the top of the network. Options: Reordered->True attempts to order the nodes on each horizontal row to eliminate crossings; Symmetrized->True centers the nodes horizontally; NodeSize is the size of disks drawn at nodes; AspectRatio is the aspect ratio; LightCone->True presents the picture the way I have described it (initial nodes at top, picture is created downwards); if it's false then initial nodes are at left and picture grows to the right; ParallelSeparation is the amount that parallel edges are separated; Dip is the amount that edges between nodes at the same time slice dip downward (if not in Hyperbola mode); Hyperbola->True puts nodes at the same time slice on hyperbolas; Arrows->True gives arrows on the edges; ArrowLength specifies the length of the line segments making up the arrows; ArrowAngle specifies the angle those segments make with the edge; ArrowLocation is a number between 0 and 1 which specifies where the arrow is on the edge (default is .6).";
DirectedNeighborsPictureR[args___]:=DirectedNeighborsPicture[args,Reordered->True]
Options[DirectedNeighborsPicture]={Reordered->False,Symmetrized->True,ParallelSeparation->.1,Dip->.35,Hyperbola->False,NodeSize->0,AspectRatio->Automatic,LightCone->True,Arrows->False,ArrowLength->.1,ArrowAngle->Pi/6,ArrowLocation->.6};
QuadraticCurve[{{a_,b_},{c_,d_},{e_,f_}},arrows_,arrowlength_,arrowangle_,arrowlocation_,ar_,up_]:=Module[{coefs,fx,fy,tangentvector,len,loc}, coefs={2#〚3〛-4#〚2〛+2#〚1〛,-#〚3〛+4#〚2〛-3#〚1〛,#〚1〛}&/@{{a,c,e},{b,d,f}}; {fx,fy}=Function[t,{t^2,t,1}.#]&/@coefs; loc=If[up,arrowlocation,1-arrowlocation]; tangentvector=(2loc#〚1〛+#〚2〛)&/@coefs; len=arrowlengthSqrt[tangentvector.tangentvector]; tangentvector=-len(tangentvector); {ParametricPlot[{fx[t],fy[t]},{t,0,1},DisplayFunction->Identity,AspectRatio->ar,PlotRange->All,Axes->False],If[arrows,Graphics[Line[{{fx[loc],fy[loc]},{fx[loc]+{Cos[#],-Sin[#]}.tangentvector,fy[loc]+{Sin[#],Cos[#]}.tangentvector}}]&/@If[up,{arrowangle,-arrowangle},{Pi+arrowangle,Pi-arrowangle}],PlotRange->All,AspectRatio->ar],{}]}]
QuadraticCurve::usage="QuadraticCurve[{{a,b},{c,d},{e,f}},arrows,arrowlength,arrowangle,arrowlocation,ar,up] creates a list of graphics objects for the quadratic curve beginning at {a,b}, passing through {c,d} and ending at {e,f}. If arrow is true, it then draws an arrow pointing towards {e,f} if up is true and towards {a,b} if up is false. The arrow is controlled by the following parameters: arrowlength is the length of the two line segments that make up the arrow (currently this is a coordinate length, not an absolute length); arrowangle is the angle these lines make with the tangent to the curve; arrowlocation is the value of the parameter t where the arrow is to be drawn (t=0 at {a,b}, .5 at {c,d} and 1 at {e,f}). Also, ar is the aspect ratio.";
TransformNW[s_]:=Module[{g,nodes,connectnodes}, g=(First/@#)&/@s; nodes=Union[Flatten[g]]; connectnodes=(Union[g〚#〚1〛,3-#〚2〛〛&/@Position[g,#]])&/@nodes; MapThread[Function[{x,y},x->({#,Count[g,{x,#}],Count[g,{x,#}|{#,x}]}&)/@y],{nodes,connectnodes}]]
TransformNW::usage="TransformNW[s] deals with directed networks with parallel edges. It takes input from SMWEvolveListNW0 and produces a list of items of the form 0->{{a1,a2,a3},{b1,b2,b3},...} where this means that: there are a2 edges going from node 0 to node a1 and a3-a2 edges going from node a1 to node 0; there are b2 edges going from node 0 to node b1 and b3-b2 edges going from node b1 to node 0; and so on.";
Examples
Examples
TransformNW[SMWEvolveListNW0[SMWEvolveListX[{"ABA""BAAB","BBBB""AA"},"ABAAB",50]]];
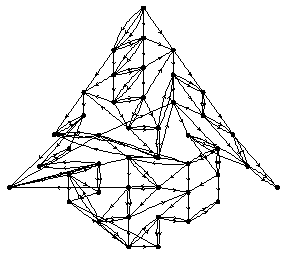
Show[DirectedNeighborsPictureR[SMWEvolveListNW[{"ABA""BAAB","BBBB""AA"},"ABAAB",25],{0},NodeSize->.065,Hyperbola->True,Arrows->True],DisplayFunction->$DisplayFunction];