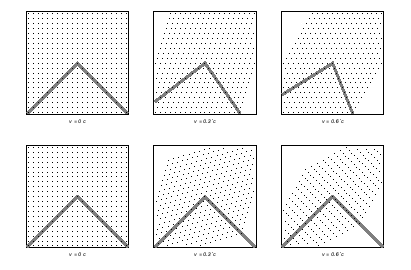
fgridc[p_]=Surround[Graphics[{{{GrayLevel[.5],Thickness[.02],Line[{{-10-10p,-10},{0,0},{10-10p,-10}}]}},Table[Point[{x+tp,t}],{x,-10,10},{t,-10,10}]},AspectRatioAutomatic,PlotRange{{-10,10},{-10,10}}]];
fgrid[p_]=Surround[Graphics[{{GrayLevel[.5],Thickness[.02],Line[{{10,-10},{0,0},{-10,-10}}]},Table[Point[{xCosh[p]+tSinh[p],tCosh[p]+xSinh[p]}],{x,-10,10},{t,-10,10}]},AspectRatioAutomatic,PlotRange{{-10,10},{-10,10}}]];
Show[GraphicsColumn[{GraphicsRow[(LabelWrapper[
fgridc[#1], StringForm["v = `` c", #1]] & ) /@
Range[0, 0.6, 0.3]],
GraphicsRow[(LabelWrapper[fgrid[#1],
StringForm["v = `` c", #1]] & ) /@
Range[0, 0.6, 0.3]]}, 0.03]];
fgridc[#1], StringForm["v = `` c", #1]] & ) /@
Range[0, 0.6, 0.3]],
GraphicsRow[(LabelWrapper[fgrid[#1],
StringForm["v = `` c", #1]] & ) /@
Range[0, 0.6, 0.3]]}, 0.03]];
ListDensityPlot[Table[If[xy<100,1,0],{x,0,20},{y,0,20}]];
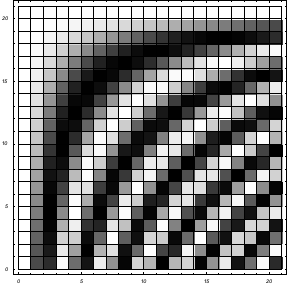
ListDensityPlot[Table[Cos[xy/10],{x,0,20},{y,0,20}]];


