m-1
∑
ln
m-1
∑
kn
l-k
β
l
β
k
β
In[]:=
XX=2Sum[Sum[x^(l-k),{k,n,l-1}],{l,n,m-1}]+Sum[1,{l,n,m-1}]
Out[]=
m-n+
2x(-1+m+n(-1+x)-mx+)
m-n
x
2
(-1+x)
In[]:=
Snm=(XX/.x->Cos[β])//FullSimplify
Out[]=
m-n+
2Cos[β](-1+m-n+(-m+n)Cos[β]+)
m-n
Cos[β]
2
(-1+Cos[β])
In[]:=
Anm=Sum[Cos[β]^(k-1),{k,n,m-1}]
Out[]=
(-)Sec[β]
m
Cos[β]
n
Cos[β]
-1+Cos[β]
In[]:=
Rnm=FullSimplify[Snm/Anm^2-1]
Out[]=
-1+(m-n+Cos[β](-2+(-m+n)Cos[β]+2))
2
Cos[β]
m-n
Cos[β]
2
(-)
m
Cos[β]
n
Cos[β]
In[]:=
F[x_,y_,β_]=Rnm/.{m->x/β^2,n->y/β^2}
Out[]=
-1+-+Cos[β]-2+-+Cos[β]+2--
2
Cos[β]
x
2
β
y
2
β
x
2
β
y
2
β
x
2
β
y
2
β
Cos[β]
2
x
2
β
Cos[β]
y
2
β
Cos[β]
In[]:=
FullSimplify[Normal[Series[F[x,y,β],{β,0,1},Direction->1]],{0<y<x}]
Out[]=
-1+
-2+2(-x+y)+x-y
1
2
2
(-)
-x/2
-y/2
In[]:=
FindMinimum-1+,{x,0,1},{y,0,x}
-2+2(-x+y)+x-y
1
2
2
(-)
-x/2
-y/2

Out[]=
FindMinimum-1+,{x,0,1},{y,0,x}
-2+2(-x+y)+x-y
1
2
2
-
-
x
2
-
y
2
In[]:=
Plot3D-1+,{x,0.0001,7},{y,0.0001,x-0.0001},PlotRange->All
-2+2(-x+y)+x-y
1
2
2
(-)
-x/2
-y/2
Out[]=

In[]:=
Plus@@Range[10]
Out[]=
55
In[]:=
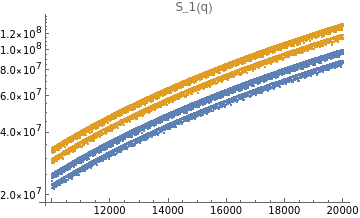
H[q_]:=Block[{pp},pp=Select[Range[q-1],GCD[#,q]==1&];(Plus@@(Cot[PiN[pp/q]]^2))]
In[]:=
H[17]
Out[]=
80.
In[]:=
Hdata={ParallelTable[{x,H[x]},{x,10000,20000,2}],ParallelTable[{x,H[x]},{x,10001,20001,2}]};
In[]:=
ListLogPlot[Hdata,PlotLegends->{"even","odd"},PlotLabel->"S_1(q)"]
Out[]=
In[]:=
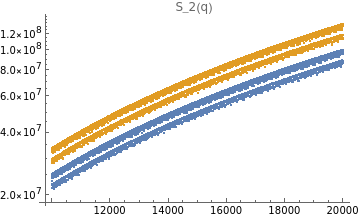
H2[q_]:=Block[{rats},rats=N[Select[Range[q-1],GCD[#,q]==1&]/q];(Plus@@(Cot[Pirats]^2Cos[2Pirats]))]
In[]:=
H2data={ParallelTable[{x,H2[x]},{x,10000,20000,2}],ParallelTable[{x,H2[x]},{x,10001,20001,2}]};
In[]:=
ListLogPlot[H2data,PlotLegends->{"even","odd"},PlotLabel->"S_2(q)"]
Out[]=
S(q)δ[1,gdc(p,q)];
q-1
∑
p1
2
cot
πp
q
Z(Q,N)δ[(N-qr)2]φ(q)
;
∑
q<Q
∑
r
N |
(N+rq)/2 |
In[]:=
ClearAll[Num,Den];
In[]:=
Den[M_,N_]:=Sum[EulerPhi[q]Sum[If[Mod[N+qr,2]==0,Binomial[N,(N+qr)/2],0]2^(-N),{r,-Floor[N/q],Floor[N/q]}],{q,2+Mod[N,2],M-2}];
In[]:=
{N[Den[100,100]],N[Den[101,101]]}
Out[]=
{241.27,7.03851}
In[]:=
entropydata=With[{N=5000},ParallelTable[{n,Log[Den[n,n]]},{n,N/2,N}]];
In[]:=
ListPlot[entropydata]
Out[]=
In[]:=
GetEvenStep[list_]:=Partition[list,2][[All,1]];GetOddStep[list_]:=Partition[list,2][[All,2]];
In[]:=
entropyEvendata=GetEvenStep[entropydata];
In[]:=
Dimensions[entropyEvendata]
Out[]=
{1250,2}
In[]:=
emodelEven=LinearModelFit[entropyEvendata,{Log[x]},x]
Out[]=
FittedModel
In[]:=
EntropyEvenPlot=Show[ListPlot[entropyEvendata,PlotStyle->{Red,PointSize[0.01]},PlotLegends->{"even data"}],Plot[emodelEven[x],{x,entropyEvendata[[1,1]],entropyEvendata[[-1,1]]},PlotStyle->{Green,Thick},PlotLegends->{emodelEven[N]},PlotRange->All],PlotLabel->"Log(Z(N)) even"]