that can be used to query specific measurements on some test data:
In[3]:=
pm=PredictorMeasurements[p,wine]
Out[3]=
In[4]:=
iceplots=pm["ICEPlots"];
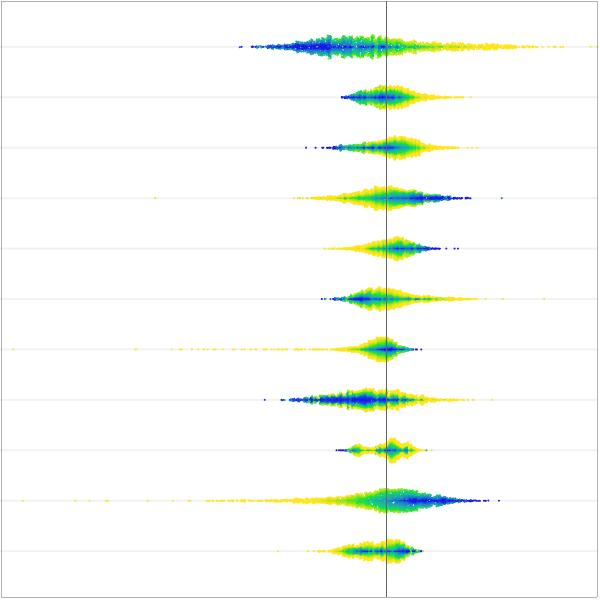
SHAP (SHapley Additive exPlanations) values offer a good insight at how much each feature is contributing to the final prediction. Here we can see each example represented as a collection of points (one for each feature) whose position represents how much they moved the prediction for that specific example away from the average.
In the specific case of numerical features, the actual feature value can be also represented as a particular color hue: