Daily updated epidemic data for novel coronavirus, including estimated cases of novel coronavirus (COVID-19) infection by country or region.
In[]:=
ResourceSearch["COVID-19"]
Out[]=
Data Source:
Data Source:
Provided by Johns Hopkins University Center for Systems Science and Engineering (JHU CCSE):
Provided by Johns Hopkins University Center for Systems Science and Engineering (JHU CCSE):
Out[]=
Out[]=
Curated data is based on:
Curated data is based on:
Preparation
Preparation
◼
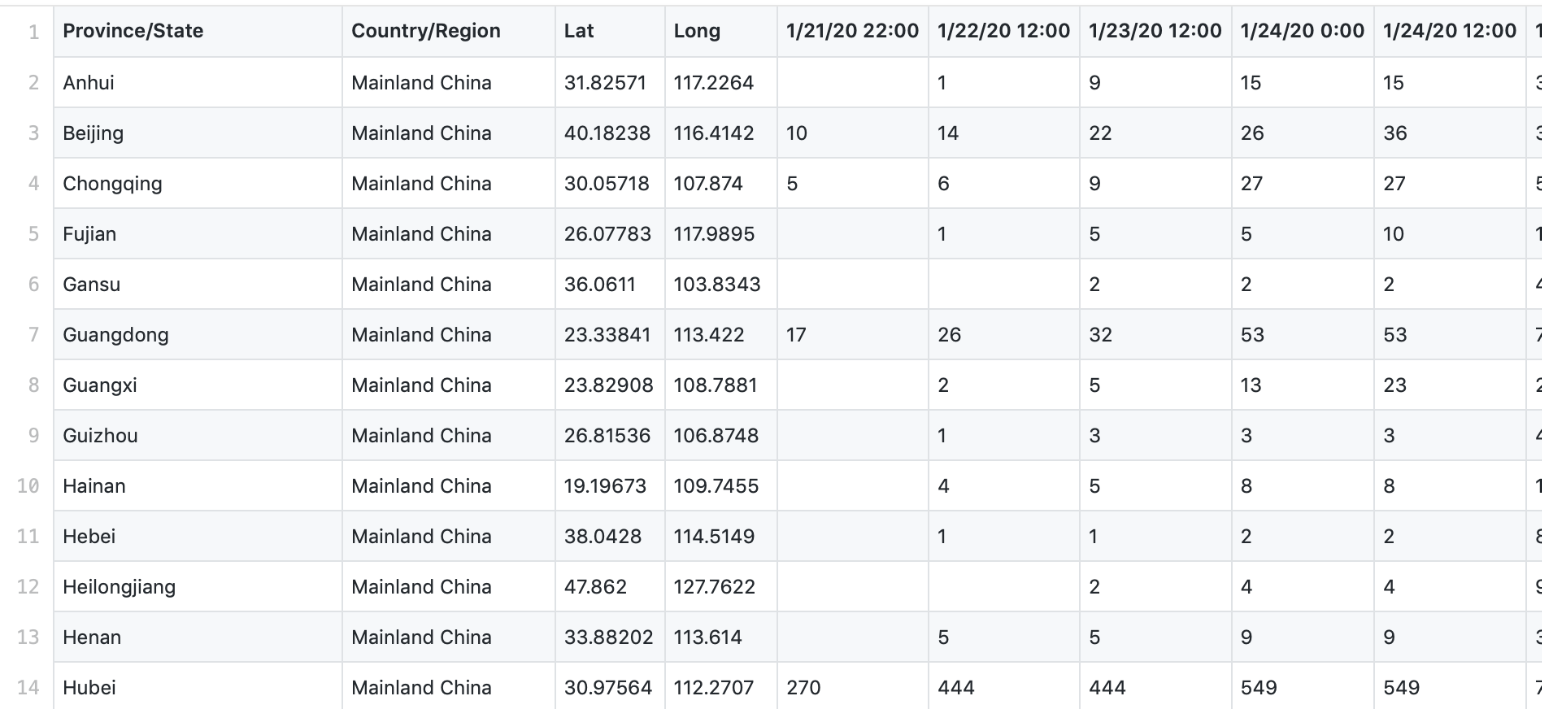
The dataset is prepared by importing/processing the CSV files and aligning to Wolfram Language (WL) entries
◼
Countries/Regions are aligned to WL Entities
◼
Interpreter function was used to find alignment to Country/AdministrativeDivision entity type
Interpreter["Country"][""]
◼
Coordinates are converted to GeoPosition
GeoPosition[{35.4437`,139.638`}]
In[]:=
GeoGraphics{GeoMarker@GeoPosition[{35.4437`,139.638`}]},GeoRange->
◼
Dates are converted to WL DateObject and then used to create the TimeSeries data
In[]:=
TimeSeries//Normal


In[]:=
DateListPlotTimeSeries
Dataset
Dataset
Retrieve the content:
In[]:=
epidemicData=ResourceData["Epidemic Data for Novel Coronavirus COVID-19"]
Available properties:
In[]:=
epidemicData[1,Keys]
Map where virus infections are confirmed:
In[]:=
GeoGraphics[{GeoMarker[DeleteMissing@Normal@epidemicData[All,#GeoPosition&],Scale5]}]
Color countries by the latest confirmed cases:
In[]:=
GeoRegionValuePlot[Normal@epidemicData[GroupBy["Country"],Total,#ConfirmedCases["LastValue"]&]]
Create a bubble chart of the confirmed cases for the regions in China:
In[]:=
ManipulateGeoBubbleChartNormal@dataSelectMatchQ,#Country&[All,{#AdministrativeDivision,#ConfirmedCases[date]}&],BubbleSizes{.01+#[[1]]/500,#[[2]]/50000}&@Normal@dataSelectMatchQ,#Country&[MinMax,#ConfirmedCases[date]&],{{date,dates[[1]],Dynamic[date]},dates},ControlTypeSlider,SynchronousInitializationFalse,SynchronousUpdatingFalse,TrackedSymbols{date},Initialization{data=ResourceData["Epidemic Data for Novel Coronavirus COVID-19"];dates=Sort@Drop[Union@Flatten@Normal@data[All,#ConfirmedCases["DateList"]&],1]}
Plot estimated confirmed cases in the regions of China over the past few days:
In[]:=
cases=epidemicDataSelectMemberQ,,,#AdministrativeDivision&[All,{"AdministrativeDivision","ConfirmedCases"}]
In[]:=
DateListPlot[Legended[#[[2]],#[[1]]]&/@cases,PlotTheme"Business",PlotLabel"estimated confirmed cases",ImageSize300,PlotRangeFull]
In[]:=
DateListLogPlot[Legended[#[[2]],#[[1]]]&/@cases,PlotTheme"Business",PlotLabel"estimated confirmed cases (log scale)",ImageSize300,PlotRangeFull]
Plot estimated recovered cases and deaths in Hubei region over the past few days:
In[]:=
recovCases=epidemicDataSelectMatchQ,#AdministrativeDivision&[All,{"RecoveredCases","Deaths"}]
In[]:=
DateListLogPlot[MapThread[Legended,{Values[#],Keys[#]}&@First@Normal@Normal@recovCases],PlotTheme"Business",PlotLabel"estimated recovered cases and deaths (log scale)",ImageSize300,PlotRangeFull]
More Data on Novel Coronavirus
More Data on Novel Coronavirus