
Combining Wolfram Language and R
Combining Wolfram Language and R
Creating a Unified Workflow
Outline
Outline
History & Comparison
Code Structure
Executing Wolfram Script from R
Executing R Code from Wolfram
ExternalEvaluate
RLink
Some Example Workflows
Resources
History & Comparison
History & Comparison
R
R

Created in 1993 by Ross Ihaka and Robert Gentleman
Current: 4.6.1 (June 2026)
Programming language for statistical computing and data visualization
Applications such as RStudio and Jupyter are popular GUIs
Licensed under GPLv2/v3
CRAN has tens of thousands of packages
Shiny apps have become a popular way to build interactive web applications from R
Wolfram Language
Wolfram Language

A combined kernel (Wolfram Language) and front-end notebook (Mathematica) interface
Multi-paradigm programming
Symbolic, as well as numerical calculations
Proprietary license model controlled by Wolfram Research
External resources include the Function/Data/Neural Net/Paclet repositories
Code Structure
Code Structure
Out[]=
Difference | R | Wolfram Language |
Brackets For Function Calls | Round ( ) | Square [ ] |
Comments | # your comment | (* your comment *) |
Indices Start From | 1 | 1 |
Whitespace | Does Not Matter | Does Not Matter |
Assignment | <- | = or := |
Vector / List | c(1, 2, 3) | {1, 2, 3} |
Out-of-the-Box Functionality
Out-of-the-Box Functionality
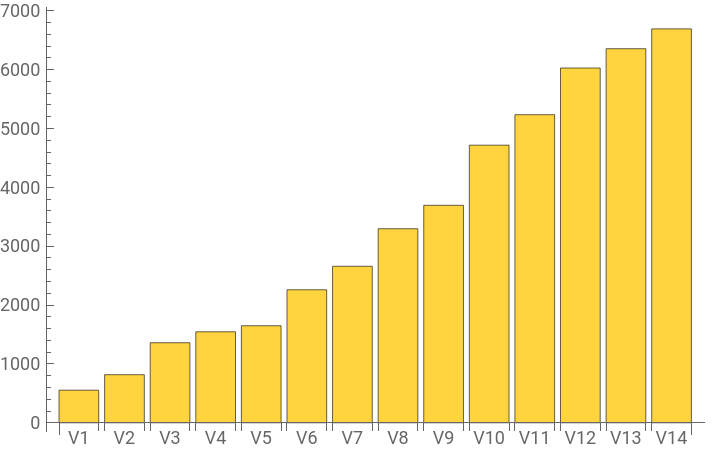
See the cumulative numbers of Wolfram Language symbols introduced in successive major versions:
Out[]=
In[]:=
RandomChoice[WolframLanguageData[]]
Principles of Wolfram Language
Principles of Wolfram Language
It’s Symbolic
It’s Symbolic
Interactive Interfaces
Interactive Interfaces
Structure of an Expression
Structure of an Expression
Using WolframScript from R
Using WolframScript from R
RStudio also allows us to use WolframScript in the Console
Drawbacks:
Difficult to pass data between the two languages
Difficult to see interactive outputs
Using R from Wolfram
Using R from Wolfram
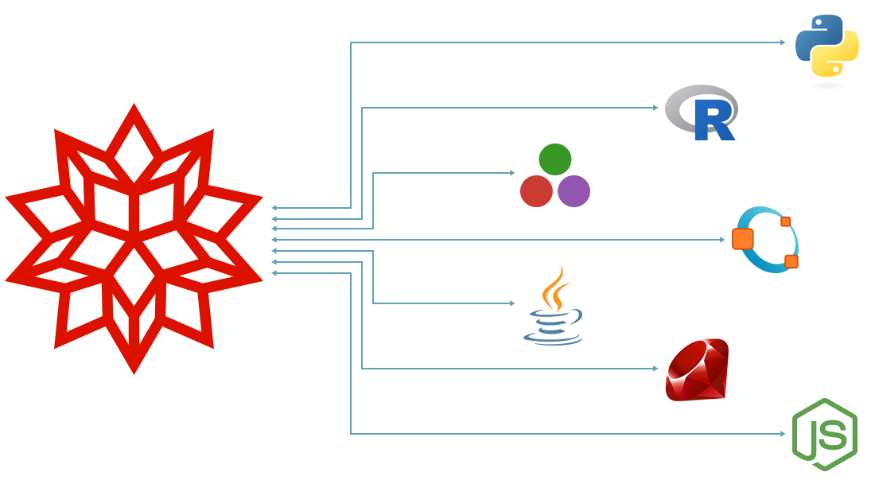
The Wolfram Language has built-in support for common external languages, as well as flexible tools for creating interfaces to any external language or program.
R is one of the languages supported by Wolfram’s External Evaluation System.
External Language Cells
External Language Cells
We can explicitly use the ExternalEvaluate function, or open an external language cell by typing “>”:
In[]:=
print("Hello R")
You can force a number to be an integer by appending L:
R vectors compared to Wolfram Language lists:
In[]:=
c(1, 2, 3, 4, 5)
Use R’s sequence operator:
Compare each language’s treatment of missing data:
In[]:=
c(1, NA, 3)
Use curly brackets for multi-line code:
In[]:=
{
simpleVar <- c(10,20,50)
simpleVarSq <- simpleVar^2
simpleVarSq
}
simpleVar <- c(10,20,50)
simpleVarSq <- simpleVar^2
simpleVarSq
}
RLink
RLink
We can also use RLink, a system application that uses JLink and RJava/JRI Java libraries to make use of R functionality.
Load the RLink package:
Configure RLink and installs the R runtime:
REvaluate
REvaluate
There is also an option to configure RLink to use an existing R installation (see Resources).
One advantage of using REvaluate over the external language cell is that you can store the output of your R code as a Wolfram Language symbol:
Which is then stored in memory and can be used without any reference to R itself:
RSet
RSet
RSet is mainly used for assigning the value of a Wolfram Language expression to a variable in R’s working environment:
Just like before, once you have the R variable, you can use it from either environment:
And you can perform R operations within the R environment:
RSet will pass a Wolfram Language object to R only if there is a suitable R representation of that object in R.
Supported types:
Sometimes, there is not an obvious representation of Wolfram Language expressions in R:
RFunction
RFunction
RFunction allows you to define a function in the R environment, store it as a Wolfram Language symbol and use it on Wolfram Language expressions.
Let’s define a function that takes a string and removes uppercase characters and replaces spaces with underscores:
Let’s define a function that takes a string and removes uppercase characters and replaces spaces with underscores:
Once you have the reference for the R function stored, you can apply it to any Wolfram expression:
Use the function on some Wolfram|Alpha species data:
Example Workflows
Example Workflows
R Plotting Functions
R Plotting Functions
It may be a viable, quick solution to store some R function you have found ‘in the wild’ as a Wolfram Language symbol and use it on your data.
Consider this function, which takes a list of binomial data and generates an overlaid plot of how the underlying proportion of success changes as each data point is added in, based on Bayesian probability calculations.
First, install the packages if you don’t already have them:
Then, simply copy and paste the R code you need and pass it to RFunction. Store that assignment in a variable:
Finally, wrap this up in a Wolfram Language function that applies the R function to an argument and then imports the resulting ggplot2 plot:
Now you can pass any binomial Wolfram Language data to your function, and you will get an R ggplot directly in Mathematica:
In this example, we did not get the resulting ggplot2 plot directly via RLink because it is a custom object that is not (automatically) supported.
Wolfram Time Series Functions
Wolfram Time Series Functions
We might have some data in an R environment, but wish to use Wolfram Language for time series analysis or forecasting.
Network Analysis
Network Analysis
R has many specialist packages. One such example is phyloseq, a tool to import, store, analyse, and graphically display complex phylogenetic sequencing data.
We might use this specialist package for constructing a microbiome network, then use Wolfram Language’s powerful functionality for network analysis.
This package is required for exporting the network:
Load the built-in dataset called ‘enterotype’, derived from human gut microbiome sequencing data.
Each sample is represented by its microbial abundance profile.
Each sample is represented by its microbial abundance profile.
Keep only samples for which the Enterotype metadata field is not missing:
Take the microbiome data and construct an igraph network.
Nodes are the samples. An edge is present between two nodes if they have a sufficiently ‘similar’ microbial community.
Nodes are the samples. An edge is present between two nodes if they have a sufficiently ‘similar’ microbial community.
Export the resulting igraph object as GraphML:
Perhaps the graph communities correspond to known biological categories?
A sample with high ‘betweenness centrality’ might represent a composition intermediate between two otherwise distinct groups:
Supplement R Data with the Wolfram Knowledgebase
Supplement R Data with the Wolfram Knowledgebase
This example imports data from a CSV file, supplements it with information from the Wolfram Knowledgebase, then continues with the analysis in R.
Import CSV File
Import CSV File
The file contains publicly available data on the coffee production (in 1,000s of 60 kg bags) of different countries from 1990 to 2018:
Display the first 10 rows:
Query the Wolfram Knowledgebase
Query the Wolfram Knowledgebase
In order to predict the coffee production of a country, we will query the Wolfram Knowledgebase for the climate and population of these countries and supplement the CSV file with this data.
Let’s start by defining an R function which cleans the country names using gsub():
Use this function on the first column of our dataset:
Now we can have the Wolfram kernel try to interpret each of these as a country, and retrieve the population of that country:
Append this new column to our original dataset, with a meaningful header:
Take the first 10 rows of the first and last columns:
We can repeat the process with the climate types for each country. First we define a function which retrieves these climate types:
We will create a dummy variable for each climate type and assign a country with 1 or 0 if it has/does not have that climate type.
First, we get all unique climate types:
First, we get all unique climate types:
These climates are entities in Wolfram Language that contain a lot of information. For our use case, we just need their names:
Create a function that will check whether a climate is contained in the list of a specific country’s climates:
And call this function on each country in our dataset:
Create a function to ensure the climate types are syntactically safe:
Again, append these new columns to our dataset:
Conduct a final check:
Pass Data to R
Pass Data to R
Create an R Data Frame using our list of lists, and specifying that the first list contains the column headings:
Note, working with a pandas DataFrame in Python with ExternalEvaluate automatically returns a Tabular object. A similar implementation is under construction for R Data Frames. For those interested, look at RDataTypeRegister!
Fitting a Linear Model in R
Fitting a Linear Model in R
Compute the mean production from 1990-2018 for each country:
Retrieve a subset of the data:
Construct the formula for, and create the linear model:
The result is a fairly complicated RObject that is more easily navigated by only extracting the relevant parts:
Finally, we create a plot of our linear model using ggplot2:
Finally, we can import the saved PNG:
Conclusion
Conclusion
Combine Wolfram Language and R workflows into a single environment
Set up RLink, then use R just as you would from RStudio, or any other IDE
Simple objects can be passed back and forth
More complicated objects require custom implementations or using common formats as a bridge between Wolfram Language and R
Resources
Resources
Other
Other
See the Wolfram Blog: Why Wolfram Tech Isn’t Open Source – A Dozen Reasons
See the Wolfram Blog: Six Reasons Why the Wolfram Language Is (Like) Open Source
See our Public Resources here
Latest Features in Wolfram Language here