MATH 166 Lecture 12: Example 2
MATH 166 Lecture 12: Example 2
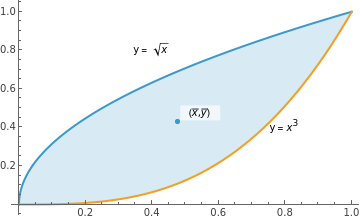
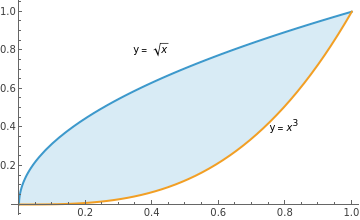
Find the centroid of the planar lamina R bounded by and .
y=
x
y=
3
x
Plot the graphs of each curve to determine region R.
Plot the graphs of each curve to determine region R.
R=Plot[,{x,0,1},Filling->1->{2},Epilog->Text["y = ",{0.8,0.4}]]
x
,3
x
x
",{0.4,0.8}],Text["y = 3
x
Out[]=
Choose f(x) to be the upper function and g(x) to be the lower function. Also determine values for endpoints x = a and x = b of the interval on which these functions are defined.
Choose f(x) to be the upper function and g(x) to be the lower function. Also determine values for endpoints x = a and x = b of the interval on which these functions are defined.
In[]:=
f[x_]:=
x
In[]:=
g[x_]:=
3
x
Solve[f[x]==g[x],x]
Out[]=
{{x0},{x1}}
In[]:=
a=0;
In[]:=
b=1;
Find the coordinates of the centroid (x, y) using the formulas established in Lecture 12.
Find the coordinates of the centroid (, ) using the formulas established in Lecture 12.
x
y
xbar=x(f[x]-g[x])x(f[x]-g[x])x
b
∫
a
b
∫
a
Out[]=
12
25
ybar=(f[x]+g[x])(f[x]-g[x])x(f[x]-g[x])x
b
∫
a
1
2
b
∫
a
Out[]=
3
7
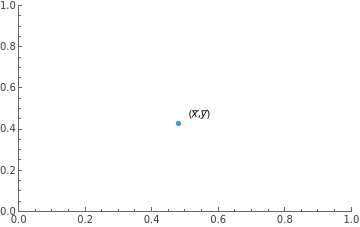
Plot the centroid.
Plot the centroid.
Centroid=ListPlot[{Labeled[{xbar,ybar},"(,)"]},PlotRange->{{0,1},{0,1}}]
x
y
Out[]=
Put the graphs of region R and centroid (x, y) on the same graph.
Put the graphs of region R and centroid (, ) on the same graph.
x
y
Show[{R,Centroid}]
Out[]=