374: Using Mathematica to Create Implicit Plots
374: Using Mathematica to Create Implicit Plots
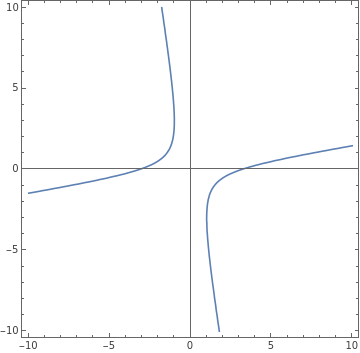
Here is how to plot a function defined implicitly by an equation such as -6xy-=C for .
2
x
2
y
C=10
ContourPlot[-6xy-10,{x,-10,10},{y,-10,10},AxesTrue,FrameTrue]
2
x
2
y