Ediger problem
Ediger problem
Ediger starts with two independent normals, one N(0, 1) and the other N(1, 3). Here’s how we get the PDF of x/y analytically.
In[]:=
fEXY[x_,y_]:=PDF[MultinormalDistribution[{0,1},{{1^2,0},{0,3^2}}],{x,y}]
In[]:=
fEXY[x,y]
Out[]=
1
2
2
x
1
9
2
(-1+y)
6π
In[]:=
$Assumptions=Element[{x,y,z},Reals]
Out[]=
(x|y|z)∈
In[]:=
fEZ=Integrate[yfEXY[yz,y],{y,0,∞}]-Integrate[yfEXY[yz,y],{y,-∞,0}]
Out[]=
-+1+GammaRegularized-,0,
-6
1+9
+2
z
1
18+162
2
z
2π
Erfc1
3
2+18
2
z
4π
1/18
3/2
(1+9)
2
z
-
2
z
2+18
2
z
1
2
1
18+162
2
z
2
2π
3/2
(1+9)
2
z
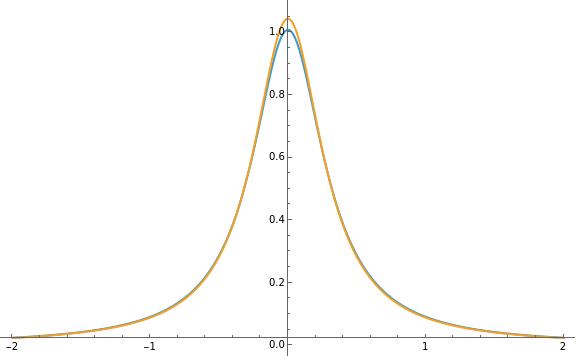
He did a curve fit to the Cauchy distribution, determining the shape and location parameters to be
In[]:=
γ=0.305159;z0=-0.000786;
In[]:=
fit=1/(γPi(1+((z-z0)/γ)^2))
Out[]=
1.0431
1+10.7386
2
(0.000786+z)
In[]:=
Plot[{fEZ,fit},{z,-2,2},PlotRange->Full,ImageSize->Large]
Out[]=