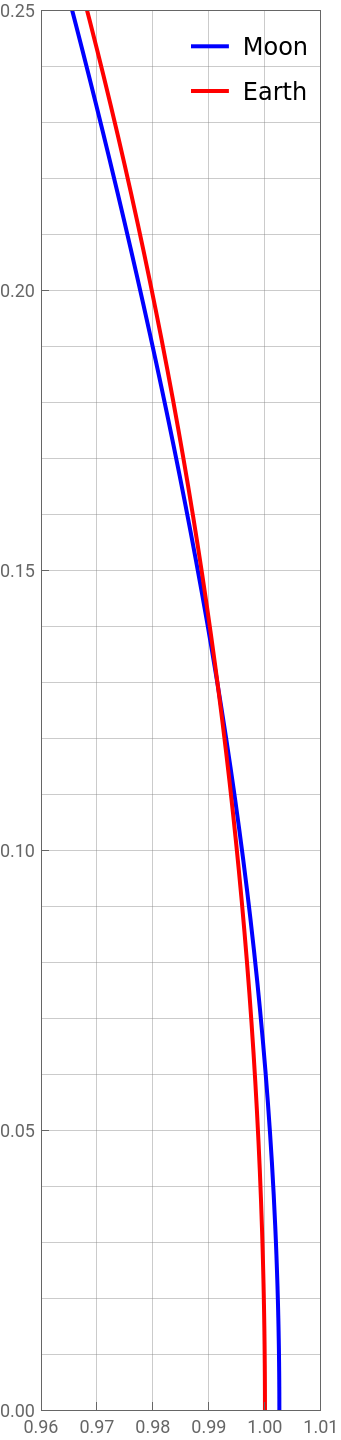
Moon and Earth orbits around the Sun
Use circles for both Earth around the Sun and Moon around the Earth.
r is the Earth-to-Moon distance, p is the Earth:Moon ratio of periods (sidereal).
Scale is in AU.
r is the Earth-to-Moon distance, p is the Earth:Moon ratio of periods (sidereal).
Scale is in AU.
In[]:=
xEarth=Cos[θ]yEarth=Sin[θ]
Out[]=
Cos[θ]
Out[]=
Sin[θ]
In[]:=
xMoon=xEarth+r*Cos[p*θ]yMoon=yEarth+r*Sin[p*θ]
Out[]=
Cos[θ]+rCos[pθ]
Out[]=
Sin[θ]+rSin[pθ]
Determine r and p from astronomical data.
In[]:=
r=Entity["PlanetaryMoon","Moon"]["AverageOrbitDistance"]/Entity["Planet","Earth"]["AverageOrbitDistance"]
Out[]=
0.002573
In[]:=
p=Entity["Planet","Earth"]["OrbitPeriod"]/Entity["PlanetaryMoon","Moon"]["OrbitPeriod"]
Out[]=
13.369
Set up the grid and tick labels for the plot.
In[]:=
xGrid=Table[x,{x,.96,1.01,.01}]
Out[]=
{0.96,0.97,0.98,0.99,1.,1.01}
In[]:=
xTicks=Table[{x,NumberForm[x,{3,2}]},{x,.96,1.01,.01}]
Out[]=
{{0.96,0.96},{0.97,0.97},{0.98,0.98},{0.99,0.99},{1.,1.00},{1.01,1.01}}
In[]:=
yGrid=Table[y,{y,0,.25,.01}]
Out[]=
{0.,0.01,0.02,0.03,0.04,0.05,0.06,0.07,0.08,0.09,0.1,0.11,0.12,0.13,0.14,0.15,0.16,0.17,0.18,0.19,0.2,0.21,0.22,0.23,0.24,0.25}
In[]:=
yTicks=Table[{y,NumberForm[y,{3,2}]},{y,0,.25,.05}]
Out[]=
{{0.,0.00},{0.05,0.05},{0.1,0.10},{0.15,0.15},{0.2,0.20},{0.25,0.25}}
Plot portions of the Earth and Moon orbits.
ParametricPlot[{{xMoon,yMoon},{xEarth,yEarth}},{θ,0,Pi/12},PlotRange->{{.96,1.01},{0,.25}},AspectRatio.25/.05,ImageSizeLarge,PlotStyle->{Directive[Blue,Thick],Directive[Red]},Frame->True,FrameTicks->{{yTicks,None},{xTicks,None}},GridLines->{xGrid,yGrid},PlotLegends->Placed[{"Moon","Earth"},{Right,Top}]]
Out[]=