Fourier series over [0, L]
Fourier series over [0, L]
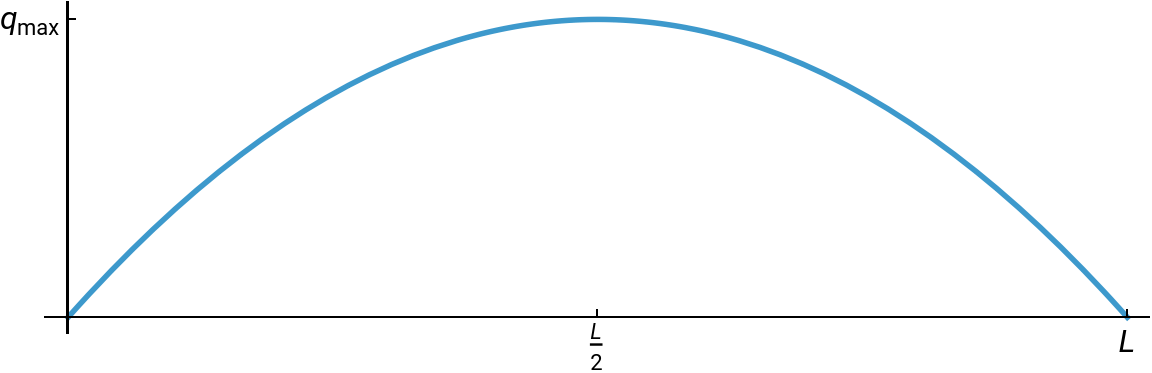
The function to approximate is parabolic
In[]:=
q=4qmaxx(L-x)
Out[]=
4qmax(L-x)x
In[]:=
Plot[q/.{L->1,qmax->1},{x,0,1},AspectRatio->.3,ImageSize->Large,Ticks->{{0,{1/2,L/2},{1,L}},{{0,0},{1,""}}},AxesStyle->Directive[Black,Thickness[.002]],PlotStyle->Thickness[.005],LabelStyle->Directive[FontSize->16]]
q
max
Out[]=
We' ll start by getting the coefficients. We need to substitute L z/π in for x in the first argument.
In[]:=
qn=FourierSinCoefficient[q/.x->Lz/Pi,z,n]
Out[]=
-
16(-1+)qmax
n
(-1)
2
L
3
n
3
π
Only the odd values of n lead to nonzero coefficients, so those are the ones we’ll keep
In[]:=
Simplify[qn,Assumptions->Mod[n,2]==0]
Out[]=
0
In[]:=
qn=Simplify[qn,Assumptions->Mod[n,2]==1]
Out[]=
32qmax
2
L
3
n
3
π
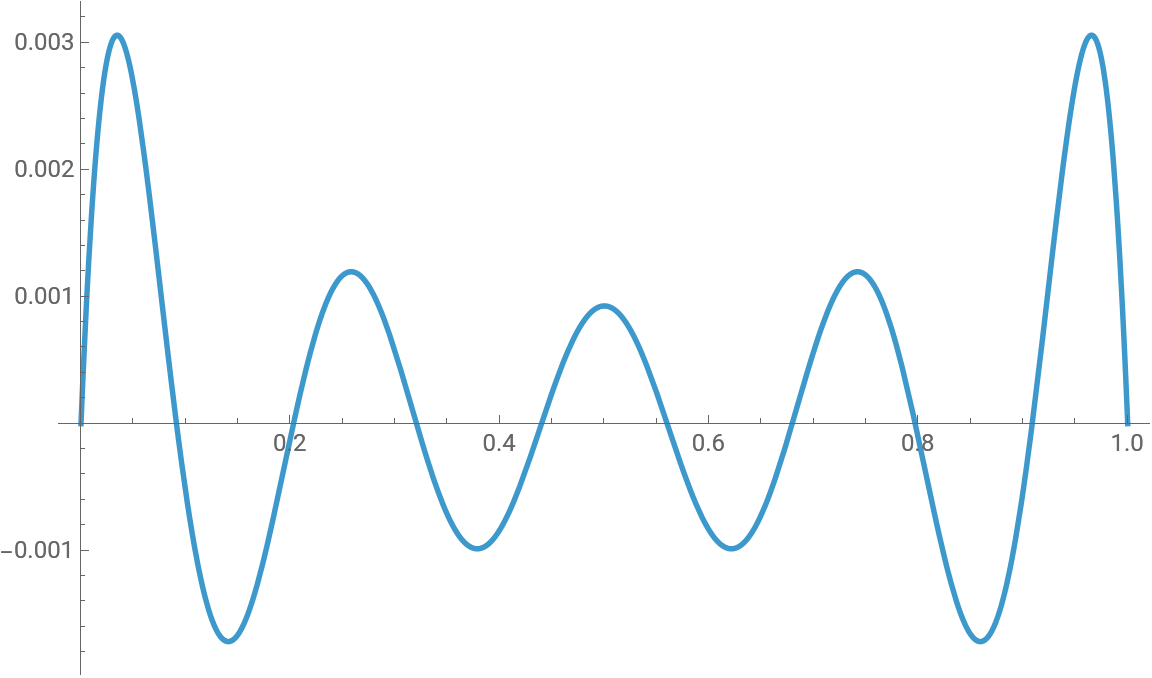
Build an approximate function from those and see how accurate it is
In[]:=
qapprox1=Sum[qnSin[nPix/L],{n,1,7,2}]
Out[]=
32qmaxSin
2
L
πx
L
3
π
32qmaxSin
2
L
3πx
L
27
3
π
32qmaxSin
2
L
5πx
L
125
3
π
32qmaxSin
2
L
7πx
L
343
3
π
In[]:=
Plot[q-qapprox1/.{L->1,qmax->1},{x,0,1},LabelStyle->Directive[FontSize->12],PlotStyle->Thickness[.005],ImageSize->Large]
Out[]=
Now let’s do it in a single step with FourierSinSeries. We do the same substitution in the first argument, then the inverse substitution after the series is made.
In[]:=
qapprox2=FourierSinSeries[q/.x->Lz/Pi,z,7]/.z->Pix/L
Out[]=
32qmaxSin
2
L
πx
L
3
π
32qmaxSin
2
L
3πx
L
27
3
π
32qmaxSin
2
L
5πx
L
125
3
π
32qmaxSin
2
L
7πx
L
343
3
π
In[]:=
Plot[q-qapprox2/.{L->1,qmax->1},{x,0,1},LabelStyle->Directive[FontSize->12],PlotStyle->Thickness[.005],ImageSize->Large]
Out[]=
They look the same. Are they?
In[]:=
qapprox1==qapprox2
Out[]=
True