Example 20.4 on p. 264 of Billingsley's book "Probability and Measures"
The distribution of the length of the maximum subinterval generated by i.i.d. n uniform random variables on [0,1]
By Le Chen.
Crated on Thu 19 Jan 2023 07:37:53 AM CST
The distribution of the length of the maximum subinterval generated by i.i.d. n uniform random variables on [0,1]
By Le Chen.
Crated on Thu 19 Jan 2023 07:37:53 AM CST
First give the cumulative distribution function
First give the cumulative distribution function
In[]:=
ψ[x_,n_]:=Sum[Binomial[n+1,k],{k,0,n+1}]
k
(-1)
n
Max[1-kx,0]
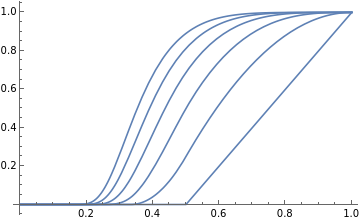
Plots of the CDF' s
Plots of the CDF' s
In[]:=
Plot[Table[ψ[x,k],{k,1,6}],{x,0,1}]
Out[]=
Plots of CDF and PDF for different n
Plots of CDF and PDF for different n
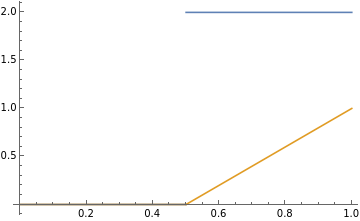
n = 1
n = 1
In[]:=
n=1;D[ψ[x,n],x]//FullSimplifyPlot[{%,ψ[x,n]},{x,0,1}]Clear[n]
Out[]=
|
Out[]=
n = 2
n = 2
In[]:=
n=2;D[ψ[x,n],x]//FullSimplifyPlot[{%,ψ[x,n]},{x,0,1}]Clear[n]
Out[]=
|
Out[]=
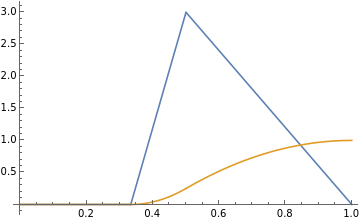
n = 3
n = 3
In[]:=
n=3;D[ψ[x,n],x]//FullSimplifyPlot[{%,ψ[x,n]},{x,0,1}]Clear[n]
Out[]=
|
Out[]=
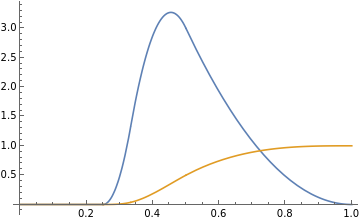
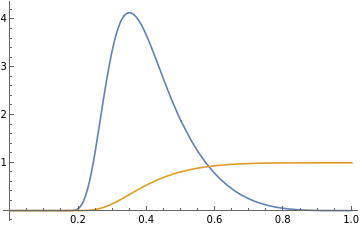
n = 4
n = 4
In[]:=
n=4;D[ψ[x,n],x]//FullSimplifyPlot[{%,ψ[x,n]},{x,0,1},PlotRangeFull]Clear[n]
Out[]=
|
Out[]=
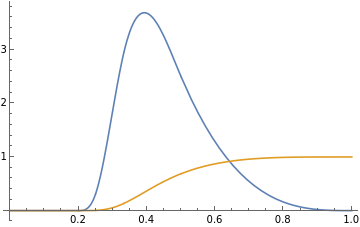
n = 5
n = 5
In[]:=
n=5;D[ψ[x,n],x]//FullSimplifyPlot[{%,ψ[x,n]},{x,0,1},PlotRangeFull]Clear[n]
Out[]=
|
Out[]=