paclets
paclets
In[]:=
(*coderequiresprototypespaclet*)Needs["PacletManager`"];
In[]:=
paclet="https://github.com/arnoudbuzing/prototypes/releases/download/v0.5.6/Prototypes-0.5.6.paclet";
In[]:=
If[PacletFind["Prototypes"]==={},PacletInstall[paclet]]
git
git
In[]:=
git=FileNameJoin[{"C:","Program Files","Git","bin","git"}];
In[]:=
repo="git@github.com:CSSEGISandData/COVID-19.git";
In[]:=
dir=FileNameJoin[{"D:","git","COVID-19"}];
In[]:=
clone[git_,repo_,dir_]:=RunProcess[{git,"clone",repo,dir}]pull[git_,dir_]:=RunProcess[{git,"-C",dir,"pull"}]
In[]:=
If[FileType[dir]===None,clone[git,repo,dir]]
In[]:=
If[FileType[dir]===Directory,pull[git,dir]]
utilities
utilities
In[]:=
todate[s_String]:=Module[{d},Quiet[d=Check[DateObject[{s,{"Month","/","Day","/","YearShort"," ","Hour",":","Minute"}}],Check[DateObject[{s,{"Year","-","Month","-","Day","T","Hour",":","Minute",":","Second"}}],$Failed]]]]
In[]:=
import[file_]:=Module[{csv},csv=Import[file,"CSV"];csv=csv[[All,1;;6]];Dataset[Map[<|"date"Interpreter["StructuredDate",DateFormat{"Month","-","Day","-","Year"}][FileBaseName[file]],"division"Interpreter["AdministrativeDivision"][First[#]<>", "<>Second[#]]/.{_FailureMissing["NotAvailable"]},"country"Interpreter["Country"][Second[#]]/.{_FailureMissing["NotAvailable"]},"updated"todate[Third[#]]/.{""Missing["NotAvailable"]},"cases"Fourth[#]/.{""0},"deaths"Fifth[#]/.{""0},"recovered"Sixth[#]/.{""0}|>&,Rest[csv]]]]
In[]:=
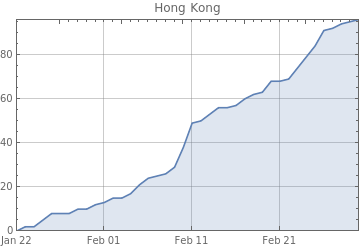
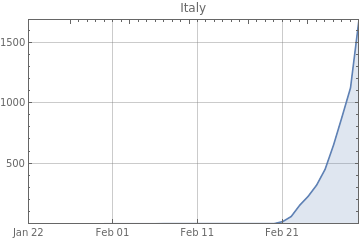
tsplot[country_]:=Module[{ts},ts=TimeSeries[N[Normal[ds[Select[#country===country&]][All,{#date,#cases}&]]]];DateListPlot[ts,PlotLabelcountry["Name"],PlotRange{{{2020,1,22},{2020,3,1}},All},FillingAxis,PlotRangePaddingNone,GridLinesAutomatic,DateTicksFormat{"MonthNameShort"," ","Day"},FrameTicks{{Automatic,Automatic},{DateRange[DateObject[{2020,1,22}],DateObject[{2020,3,1}],Quantity[10,"Days"]],Automatic}}]]
In[]:=
DateRange[DateObject[{2020,1,22}],DateObject[{2020,3,2}],Quantity[1,"Weeks"]]
Out[]=
,,,,,
analysis
analysis
In[]:=
path=FileNameJoin[{dir,"csse_covid_19_data","csse_covid_19_daily_reports"}];
In[]:=
dailies=FileNames["*.csv",path];
In[]:=
datasets=import/@dailies;
In[]:=
ds=Join@@datasets;
In[]:=
tsplot
Out[]=
In[]:=
tsplot
Out[]=
In[]:=
countries=DeleteMissing[ds[Union,"country"]];
In[]:=
out=Multicolumn[tsplot/@Normal[countries],5];
In[]:=
Export["D:\\git\\wolfram-coronavirus\\images\\cases-by-country.png",out]
Out[]=
D:\git\wolfram-coronavirus\images\cases-by-country.png
In[]:=
TimeSeries[KeyValueMap[List,Normal[ds[GroupBy[#date&],Total[#[[All,5]]]&]]]]
In[]:=
DateListPlot[%]
In[]:=
ts2=ds[GroupBy[#division&],TimeSeries[Map[{#["date"],#["cases"]}&,#]]&]
In[]:=
ts2[KeySelect[Not[MissingQ[#]]&]]
In[]:=
DateListPlot[ts2[KeySelect[Not[MissingQ[#]]&]],PlotRangeAll]
In[]:=
ts3=ds[GroupBy[#country&],TimeSeries[Map[{#["date"],#["cases"]}&,#]]&];
In[]:=
DateListPlot[ts3[KeySelect[Not[MissingQ[#]]&]],PlotRangeAll]
In[]:=
StackedDateListPlot[ts3[KeySelect[Not[MissingQ[#]]&]]]