In this application an anemometer is simulated. An anemometer is a device that can be attached to fluid flowing through, say, a pipe and measure the flow velocity in a contact less manner. For this a small section in the device is heated and the flow passing over the heater will distort the temperature profile generated by the heater. The distortion of the temperature profile can be measured and from the difference in temperature the velocity of the fluid passing the device can be computed.
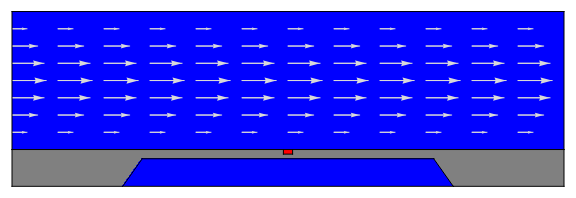
Here is a sketch of the device. The device (in gray) is made of silicon and has a small heater (red) also made of silicon embedded. We have air (blue) passing over the device. The lower blue part is also air but no flow field is present there.
Out[118]=
To model the device a convection diffusion equation is used:
∇·(-c∇u)+β·∇u=f.
(
1
)
The coefficients
c
,
β
and
f
will have different values in different material regions in the simulation domain.
c
is a diffusion coefficient and is active in the entire simulation domain, however, different values apply in different regions.
β
is a convection coefficient and is only active where the fluid is flowing over the device.
f
is a load coefficient and will be used to model the heater in the device.
We start by manually setting up a boundary geometry. First some device parameters like sizes and angles are set up.
Now, that a boundary mesh is set up the full mesh is constructed. The boundary mesh is augmented with region markers. These are specified by a coordinate point inside the respective sub-region, an integer marker and a specification for the amount of refinement in that sub-region.
Generate coordinates in the different sub-regions.
Visualize the marker coordinates in the boundary mesh.
Generate the full mesh with region markers and specified mesh element refinement sizes.
Visualize the mesh with air in blue, silicon in gray and the heater in read.
All in all, we have four different parts in the simulation domain. The silicon device, the heater, to flow region and the cut out underneath the silicon. The material data for the silicon and the heater is the same and so is the air above and below the silicon.
Inspect the region markers.
Visualize the part of the mesh that has ElementMarker set to 1.
Next the material data is set up. The material data will have different values in different sub-regions of the device.
Setup the anisotropy.
Set up the convection.
Plot the convection flow profile.
Visualize the flow field above the silicon.
Set up the load.
Set up the boundary conditions.
Solve the partial differential equation.
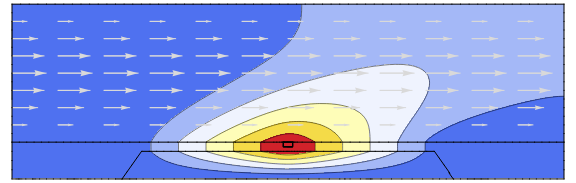
Visualize the solution.
Compute the minimum and maximum temperatures.
Compute the temperature difference between to points on the device.