RQA Validation problems-
RQA Validation problems-
Flip Phillips, Aug 19
Intro
Intro
I am presently trying to validate my RQA package to Webber’s computations from the RQA151 code and included paper. Most of the measurements come out consistent with those in the paper. Some don’t and I’m trying to track that down.
The HENCX dataset included with the RQA151 distribution doesn’t seem to be the same as the one used in the chapter-
Webber Jr, C. L., & Zbilut, J. P. (2005). Recurrence quantification analysis of nonlinear dynamical systems. Tutorials in contemporary nonlinear methods for the behavioral sciences, 94, 26-94. https://www.nsf.gov/pubs/2005/nsf05057/nmbs/chap2.pdf
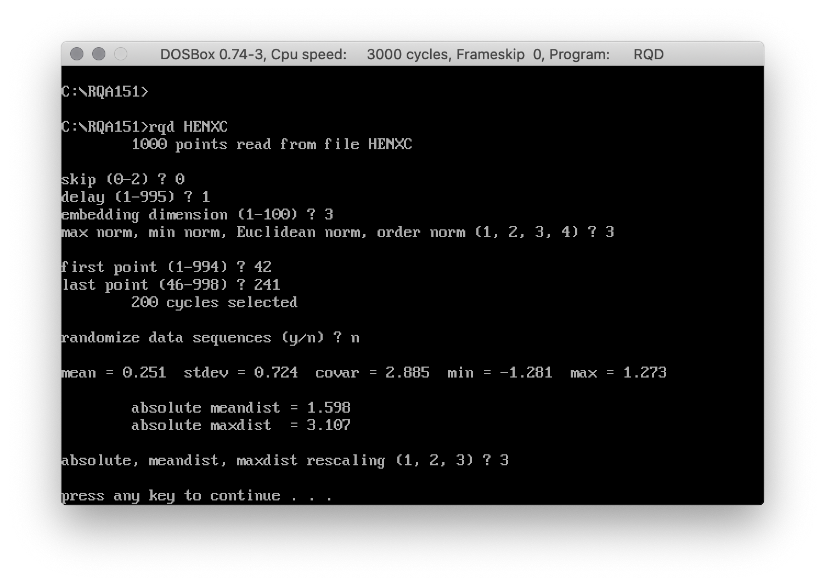
It looks like the pattern they used in that paper starts around t=42 ± so I just pulled the next 200 off of that. Here are the results from RQD.EXE:
In[]:=
In[]:=
Note that – even though the sequence is length 200, the rendered distance/recurrence matrix is 201x201... maybe it treats the data as periodic? I’m even further confused since, when embedding the data in a 3-D manifold, there are, by definition, only n-d+1 valid points in this space (again, unless there is some periodicity employed), so the real dimensionality of that should be 198x198, if anything.
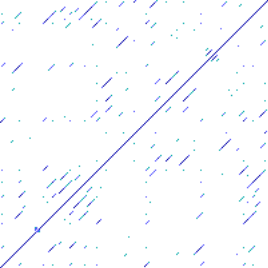
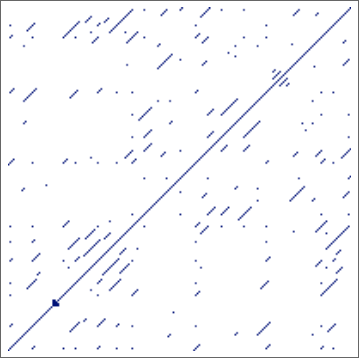
I screen-grabbed the RM (and inverted the colors so I could see it) —
In[]:=
wrm=
;
In[]:=
ImageDimensions[wrm]
Out[]=
{201,201}
Here’s a recurrence map structure, derived from that image, which we can use to check some of the calculations:
In[]:=
rmx=1-Reverse@ImageData[Binarize[wrm]];
Secondly, I calculated the recurrence coordinates using RQC.EXE. I noted that the diagonal has ‘points’ but the distance is 0.0. This suggests to me that, like I mention above, I might be missing some 0-distance locations.
In[]:=
rpts=Import["~/Desktop/HX","Table"];
In[]:=
Length[rpts]
Out[]=
764
In[]:=
dmx=SparseArray[#[[1;;2]]#[[3]]&/@rpts]
Out[]=
SparseArray

In[]:=
ArrayPlot[dmx,DataReversedTrue,PlotLegendsAutomatic,FrameTicksNone,ColorFunctionColorData["Temperature"]]
Out[]=
But, maybe the recurrence matrix should have ‘1’s where those 0-locations are.
In[]:=
rmx2=Normal[SparseArray[#[[1;;2]]1&/@rpts]];
In[]:=
ArrayPlot[rmx2,DataReversedTrue,PlotLegendsAutomatic,FrameTicksNone,ColorFunctionScalingTrue,ColorFunctionColorData[{"DarkTerrain","Reverse"}]]
Out[]=
Notice that this array is 200x200. I’m guessing that there is no truncation post-embedding.
So, let' s compare my RQA with Webber 151.
data
data
Load the package:
Load the data:
Create a time series:
Close enough to this, from the paper (and, remember, I went ahead and ran the same analysis in RQD from RQA151 above too):
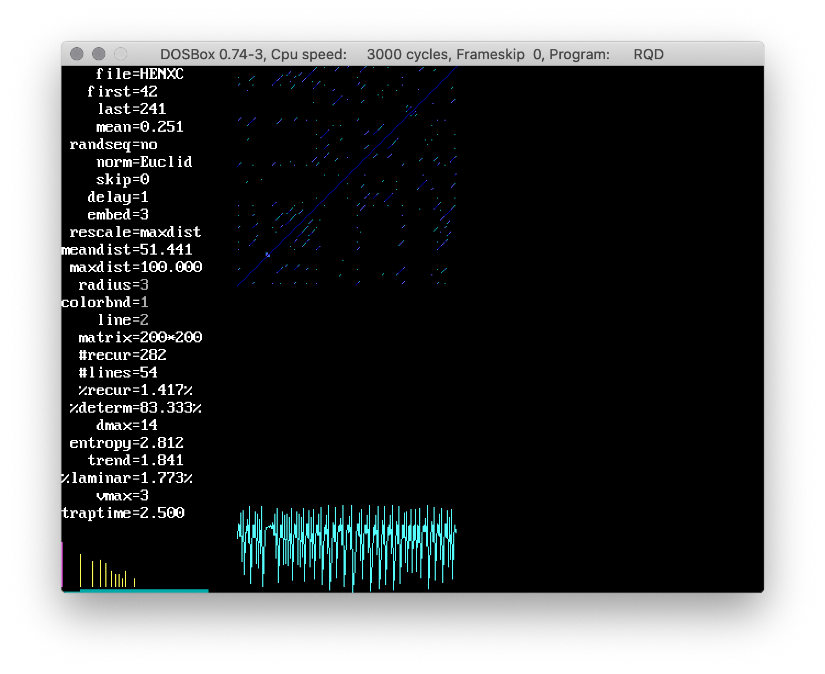
Statistical measures are the same, according to the RQD output:
embedding and distance / recurrence maps
embedding and distance / recurrence maps
Embedding, 3D, τ =1:
Notice that we are using “Truncate” which makes the embedded time series a proper length with valid locations for the embedding. I should add “Periodic” maybe.
Distance matrix:
Range is the same as the RQD calculations, roughly:
Mean distances:
Now, there is a normalizing step in the RQD that I don’t quite understand why. It scales to ‘maxdist’ which leads to some crazy distances reported in the output. It looks like it shifts distances to a range of 0-100. We’re just going to do 0-1 because I think that’s what’s going on, then we’ll treat distances appropriately.
If we do the rescale w/ the 200x200 map onto 0-100 like Webber, we get:
His mean is 51.441, so there is something going on there. I wonder if there is an off-by-one or something, since the RQD matrix above is 201x201 and ours is 198x198 because of the embedding?
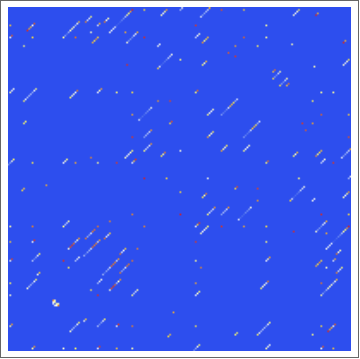
This computes the recurrence map for a given threshold distance. The paper uses a Radius=3 so on the 0-100 scale that’s:
Also, our rescale is just a generic minmax rescale. “RescaleFunction” gives you the ability to use different functions.
Here is a recurrence map which looks essentially the same as the one above. I’m not sure why all the Webber maps have the diagonal in place. For all of those locations, the distance is 0 and, I suppose, there is recurrence by definition? Perhaps this is the problem with my calculations below?
parameter estimates
parameter estimates
#recur
#recur
I’m doing these in the order that they are stated in the RQD output screen. Firstly, #recur = 282, we get:
Even more interesting, if I use the recurrence map generated by RQD.EXE, above, I don’t get 282 either:
so I’m a little concerned that might be off because of the rescaling/thresholding above? Or because of the dimensionality of the output rm (more likely).
Using the RQC output
So, to sum up, I’m not quite sure what is going on here. I wonder if the diagonal has more utility than I am giving it credit for. There’s basically nothing I seem to be able to do to get the #lines points to the right place. So I’m a little stuck. This, of course, has downstream problems with the calculations of parameters.
#lines
#lines
Vertical
Same for those in the RQC
Diagonal lines:
In summary then all calculations are a little short of the RQD numbers above. I wonder if the thresholding is a problem when using a radius of 3 vs .03? Or- and more likely, if there is periodicity in the calculations there may be a bunch around the edge. I think I’ll need the code from RQD to check.
Recurrence
Recurrence
RQD = 1.417%
We are different, but it is because of the under/misestimation of NRecurrentPoints
Determinism
Determinism
RQD = 83.333%
DMax
DMax
RQD = 14
Entropy
Entropy
RQD = 2.812
Trend
Trend
Broken
Laminarity
Laminarity
RQD = 1.773%
Trapping Time
Trapping Time
VMax
VMax