Slide Ruler
Slide Ruler
How a slide ruler works
How it Works
How it Works
The logs have a hidden superpower. They transform all the multiplication and division into simple additions and subtractions. While it doesn’t necessarily help by hand, but it can become really useful when converting mechanical movement into mathematical operation. This principle is used in the slide ruler, where the user adds the length of the band to perform a multiplication or subtract that length to do a division.
How to Use
How to Use
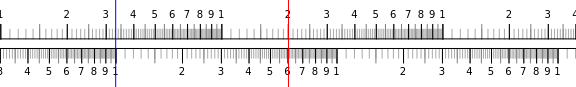
The following are the basic manipulations for multiplication and division. More advanced manipulation exists on more complex slide rulers that include operations like squares, cubes and square roots. On most slider rulers, the red and blue lines don’t exist; they are there to help you understand the operation.
Multiplication
Multiplication
1
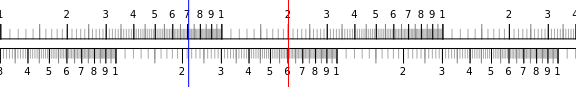
.On the top band, find the number you want to multiply. You can place it under the red line to help tracking it. In the example, “2×6” place the red line above 2.

2
.Place the bottom band, place the number 1 one just under the number you want to multiply. If you are using the red line, it would also be under the red line.
3
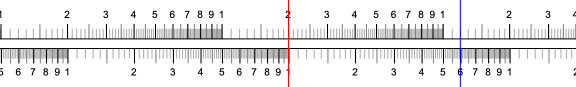
. On the bottom band, all the numbers will now correspond to the other term of the multiplication. Find the number you want to multiply by going to the right, you can place the blue line on the number. By looking at the number on the top band, you can find the answer. In the example, “2×6” place the line above 6. The top band under the blue line reads 1.2, since you passed 1, you multiply by 10, so the result is 12.
4
. Take the time to see that all the multiplications are there, above the 2, there is a 4, above the 5, 10. This is one of the reasons that aviators still use slide rulers. So, if you are consuming fuel at the rate of 2 liters per minute, the minutes become the lower band and the total liters consumed becomes the top band. Lock it and place and you don’t need to compute it each time!
Note: It works both sides, except that it’s a bit harder to track the “1s” going left. You can also use the bottom band as a starting point and work on the top band.
Division
Division
1
.On the top band, find the number you want to divide. To help you can place it under the red line. In the example, “2/6” place the line above 2.
2
.On the bottom bar, place the number you want to divide by directly under the first. If you are tracking with the the red line, both should be under it.
3
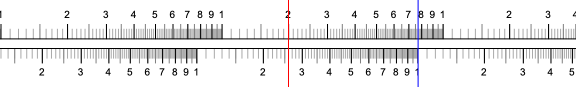
.Find the number 1 on the bottom band, you can place the blue line above it. Look at the number facing it on the top band and divide by 10 for each 1 is passed. In the example, “2/6” we read 3.3 and we pass by 1 one time, so the answer is 0.33
4
.TaTake time to see that you now have all the multiplications of your corresponding to the result. If you were consumed 2 litres of fuel for the last 6 minutes, you are consuming it at 0.33 litres per minute. The top band is now the litre and the bottom of the minutes. As you can track with the ruler, after 3 minutes you would have consumed 1.0 litres, after 9 minutes 2.9 litres.
Unit Conversion
Unit Conversion
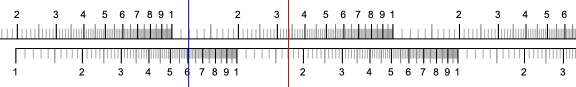
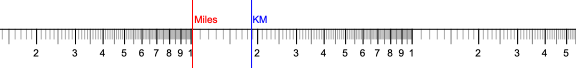
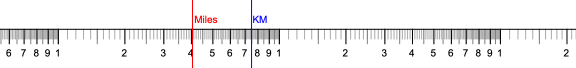
The mechanism can be used to do all the unit conversions that only involve multiplication. An example could be nautical miles and km, where 1 nautical mile is 1.852 km. So, by setting the two points log(1.852) apart, you can do the conversion!
Ex: 1 miles to 1.85 km, or 1.85 km to 1 miles
Ex: 40 miles to 74 km, or 74 km to 40 miles
Drawing
Drawing
In[]:=
(*Protectsomesymbolsthatwillbeusedasoptions*)Protect[{Orientation,Major,Minor}];
In[]:=
Options[rulertick]={Orientation->Top,Style->Major};rulertick::usage="rulerTick[value, point] Draw a tick on at the point.";rulertick[v_?NumericQ,p_?NumericQ,OptionsPattern[]]:=Module[{ori=OptionValue[Orientation],style=OptionValue[Style]},Return@Switch[style,Major,{Line[{{p,0},{p,If[ori==Top,1,-1]*0.15}}],Text[NumberForm[v],{p,If[ori==Top,1,-1]*0.25}]},Minor,{Gray,Line[{{p,0},{p,If[ori==Top,1,-1]*0.15}}]},Tiny,{Lighter[Gray],Line[{{p,0},{p,If[ori==Top,1,-1]*0.10}}]}];];rulertick[v_,p_,OptionsPattern[]]:=Failure["Bad Arguments","MessageTemplate"->"The arguments to the function should be numbers."];Options[ruler]={Orientation->Top};ruler::usage="ruler[segments] Draw a slideruler composed of the number of 1 to 9 segments defined in the argument.";ruler[segments_Integer,OptionsPattern[]]:=Module[{ori=OptionValue[Orientation],(*Thecoreoftheruleristhisline.Thelabelisv,andthepositionontheruleristhelogofthisvalue*)majorLines=Table[{v,Log[v]},{v,1,9}],(*Minorsticksat0.5and0.1,thosearenotlabeled*)minorLines=Table[{v,Log[v]},{v,1,10-0.5,0.5}],tinyLines=Table[{v,Log[v]},{v,1,10-0.1,0.1}]},Return@Table[Translate[{(*Theorderisimportant,themoreimportticksareprintedabovethelesser*)rulertick[#1,#2,Style->Tiny,Orientation->ori]&@@@tinyLines,rulertick[#1,#2,Style->Minor,Orientation->ori]&@@@minorLines,rulertick[#1,#2,Orientation->ori]&@@@majorLines,{Line[{{0,0},{Log[10],0}}]},{Line[{{Log[10],0},{Log[10],If[ori==Top,1,-1]*0.15}}]}},{Log[10^delta],0}],{delta,0,segments-1}];];ruler[segments_,OptionsPattern[]]:=Failure["Bad Arguments","MessageTemplate"->"The argument to the function should be an integer."]
To Try
To Try
In[]:=
segments=5;Manipulate[Graphics[{Translate[ruler[segments],{tr,0}],Translate[ruler[segments,Orientation->Bottom],{br,-0.1}],{Red,InfiniteLine[{{3,-1},{3,1}}]},{Blue,InfiniteLine[{{mkr,-1},{mkr,1}}]},},PlotRange->{{0,6},{-0.5,0.4}},ImageSize->Large],{{tr,0},-10,5},{{br,0},-10,5},{{mkr,4},0,6}]
Out[]=


In[]:=
unitConvertion=1.85;unitBase="Miles";unitTo="KM";segments=5;Manipulate[Graphics[{Translate[ruler[segments,Orientation->Bottom],{br,-0.1}],{Red,InfiniteLine[{{2,-1},{2,1}}],Text[unitBase,{2,0.},{-1.2,0}]},(*ThislineisLog[1.852]awayfromtheredone,doingtheconversion*){Blue,InfiniteLine[{{cp=2+Log[unitConvertion],-1},{cp,1}}],Text[unitTo,{cp,0.},{-1.2,0}]},},PlotRange->{{0,6},{-0.5,0.2}},ImageSize->Large],{{tr,0},-10,5},{{br,0},-10,5}]
To Print
To Print
You can use your favourite image editor and rescale the ruler, it won’t affect the math behind. Provided that you keep both sides of the ruler at the same scale (that is why I joined them in the same image). If the ticks are too dense, reduce the number of segments. Feel free to change the conversion.