ORIGINAL ARTICLE: Sultanow, E., Henkel, M. & Aberkane, I.J. Diophantine imaging reveals the broken symmetry of sums of integer cubes. Scientific Reports 14, 16 (2024). https://doi.org/10.1038/s41598-023-49960-y
GITHUB
GITHUB
Article Abstract: We introduced a novel method for visualizing large diophantine datasets and in particular found that mapping the known integer triplets solving either equations of the type ++=d or ++= on certain proper subgroups of the circle group exposed a very clear breaking in their symmetry and a strongly non-ergodic distribution of the solutions of sums of three cubes that had never been described before. This method could be further applied to a larger diversity of diophantine problems, informing both number-theoretical conjectures and novel methods in computer sciences on the way, along with paving the road for specific uses of machine learning in exploring diophantine datasets with possible applications in cryptography among others.
{a,b,c}
3
a
3
b
3
c
3
a
3
b
3
c
3
d
Integer cubes in base 2
Integer cubes in base 2
Functions Definitions
Functions Definitions
In[]:=
ClearAll["Global`*"]rotate[n_]:=(alpha=2*Pi*fnfact[n];x=-Sin[alpha];y=Cos[alpha];{x,y});fnfact[n_]:=n/(2^(Floor[Log[2,n]]+1)-2^Floor[Log[2,n]]);intersectLines[line1_,line2_]:=(a11=line1[[1,2]]-line1[[2,2]];a12=line1[[2,1]]-line1[[1,1]];det1=Det[line1];a21=line2[[1,2]]-line2[[2,2]];a22=line2[[2,1]]-line2[[1,1]];det2=Det[line2];detx=Det[{{a12,det1},{a22,det2}}];dety=Det[{{det1,a11},{det2,a21}}];det=Det[{{a11,a12},{a21,a22}}];If[det>0,{detx/det,dety/det},{0,0}]);getTriangleLines[row_]:=(pointA=rotate[Abs[row[[1]]]];pointB=rotate[Abs[row[[2]]]];pointC=rotate[Abs[row[[3]]]];Line[{pointA,pointB,pointC,pointA}]);getPercentageArea[row_]:=(pointA=rotate[Abs[row[[1]]]];pointB=rotate[Abs[row[[2]]]];pointC=rotate[Abs[row[[3]]]];Area[Triangle[{pointA,pointB,pointC}]]/Area[Disk[]]);isInArea[value_,min_,max_]:=(value≥min&&value≤max);
Data Retrieval
Data Retrieval
Now we import the threecubes_ 20070419.csv dataset (from Andreas-Stephan Elsenhans and Joerg Jahnel) that contains a list of solutions of ++n for .
3
x
3
y
3
z
n<1000
csv=Import[FileNameJoin[{NotebookDirectory[],"datasets","threecubes_20070419.csv"}]];csv=Map[Function[{row},{row[[2]],row[[3]],row[[4]]}],csv];csv=Select[csv,Function[{row},row[[1]]!=0&&row[[2]]!=0&&row[[3]]!=0]];csv=Select[csv,Function[{row},Abs[row[[1]]]>7&&Abs[row[[2]]]>7&&Abs[row[[3]]]>7]];csv=csv[[1;;10000]];triangleLines=Map[getTriangleLines,csv];plotPercentageRange[triangles_,from_,to_]:=(filteredTriangles=Select[triangles,Function[t,isInArea[getPercentageArea[t],from,to]]];lines=Map[getTriangleLines,filteredTriangles];Graphics[{Text[Style[ToString[Floor[from*100]]<>"% - "<>ToString[Floor[to*100]]<>"%",Black,FontSize10],{-1,1}],Circle[],Purple,Opacity[1],Thickness[0.0001],lines,PlotRange{{-1,1},{-1,1}},AspectRatio1}]);start=0.0;stop=0.45;step=0.025;plots=Table[plotPercentageRange[csv,n,n+step],{n,start,stop,step}];GraphicsGrid[{plots[[1;;6]],plots[[7;;12]],plots[[13;;18]]},ImageSize2000]
Plotting the solutions
Plotting the solutions
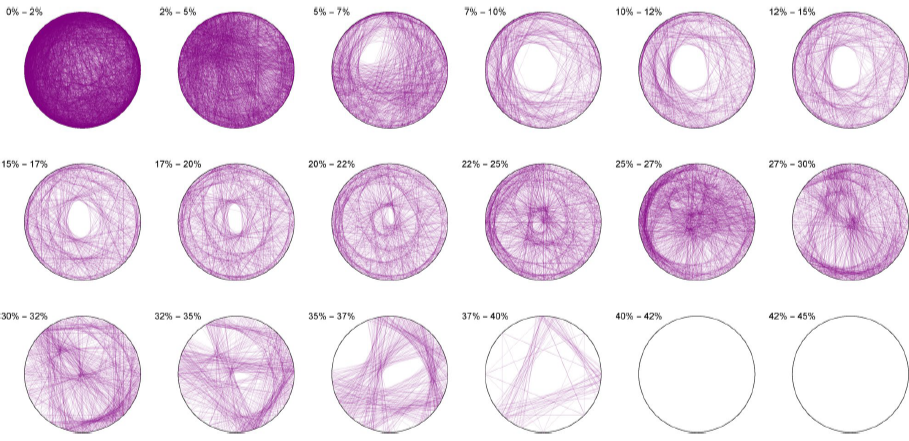
The following pictures visually illustrate the solutions of the Diophantine equations. We display a percentage range above each circle, which indicates the percentage coverage of the circle area by each triangle. For example, 0% - 2% means that in this particular circle only triangles are drawn, each of which covers not more than 2% of the circle area.
The Diophantine imaging of sums of integer cubes in base 2 reveals a very precise fingerprint with quasi-envelopes emerging even for narrow triangles.
Cubic quadruples base 2
Cubic quadruples base 2
ClearAll["Global`*"]rotate[n_]:=(alpha=2*Pi*fnfact[n];x=-Sin[alpha];y=Cos[alpha];{x,y});fnfact[n_]:=n/(2^(Floor[Log[2,n]]+1)-2^Floor[Log[2,n]]);intersectLines[line1_,line2_]:=(a11=line1[[1,2]]-line1[[2,2]];a12=line1[[2,1]]-line1[[1,1]];det1=Det[line1];a21=line2[[1,2]]-line2[[2,2]];a22=line2[[2,1]]-line2[[1,1]];det2=Det[line2];detx=Det[{{a12,det1},{a22,det2}}];dety=Det[{{det1,a11},{det2,a21}}];det=Det[{{a11,a12},{a21,a22}}];If[det>0,{detx/det,dety/det},{0,0}]);getTriangleLines[row_]:=(pointA=rotate[Abs[row[[1]]]];pointB=rotate[Abs[row[[2]]]];pointC=rotate[Abs[row[[3]]]];Line[{pointA,pointB,pointC,pointA}]);getPercentageArea[row_]:=(pointA=rotate[Abs[row[[1]]]];pointB=rotate[Abs[row[[2]]]];pointC=rotate[Abs[row[[3]]]];Area[Triangle[{pointA,pointB,pointC}]]/Area[Disk[]]);isInArea[value_,min_,max_]:=(value≥min&&value≤max);csv=Import["C:/Users/esultano/git/pedal_curves/mathematica/datasets/313.csv","Table"];csv=Map[Function[{row},{row[[2]],row[[3]],row[[4]]}],csv];csv=Select[csv,Function[{row},row[[1]]!=0&&row[[2]]!=0&&row[[3]]!=0]];csv=Select[csv,Function[{row},Abs[row[[1]]]>7&&Abs[row[[2]]]>7&&Abs[row[[3]]]>7]];csv=csv[[1;;10000]];triangleLines=Map[getTriangleLines,csv];plotPercentageRange[triangles_,from_,to_]:=(filteredTriangles=Select[triangles,Function[t,isInArea[getPercentageArea[t],from,to]]];lines=Map[getTriangleLines,filteredTriangles];Graphics[{Text[Style[ToString[Floor[from*100]]<>"% - "<>ToString[Floor[to*100]]<>"%",Black,FontSize20],{-1,1}],Circle[],Brown,Opacity[0.25],Thickness[0.0001],lines,PlotRange{{-1,1},{-1,1}},AspectRatio1}]);start=0.0;stop=0.45;step=0.025;plots=Table[plotPercentageRange[csv,n,n+step],{n,start,stop,step}];GraphicsGrid[{plots[[1;;6]],plots[[7;;12]],plots[[13;;18]]},ImageSize2000]
CITE THIS NOTEBOOK
CITE THIS NOTEBOOK
Diophantine imaging reveals the broken symmetry of sums of integer cubes
by Eldar Sultanow, Max Henkel & Idriss Aberkane
Wolfram Community, STAFF PICKS, January 31, 2024
https://community.wolfram.com/groups/-/m/t/3113595
by Eldar Sultanow, Max Henkel & Idriss Aberkane
Wolfram Community, STAFF PICKS, January 31, 2024
https://community.wolfram.com/groups/-/m/t/3113595