The Lorenz Curve
The Lorenz Curve


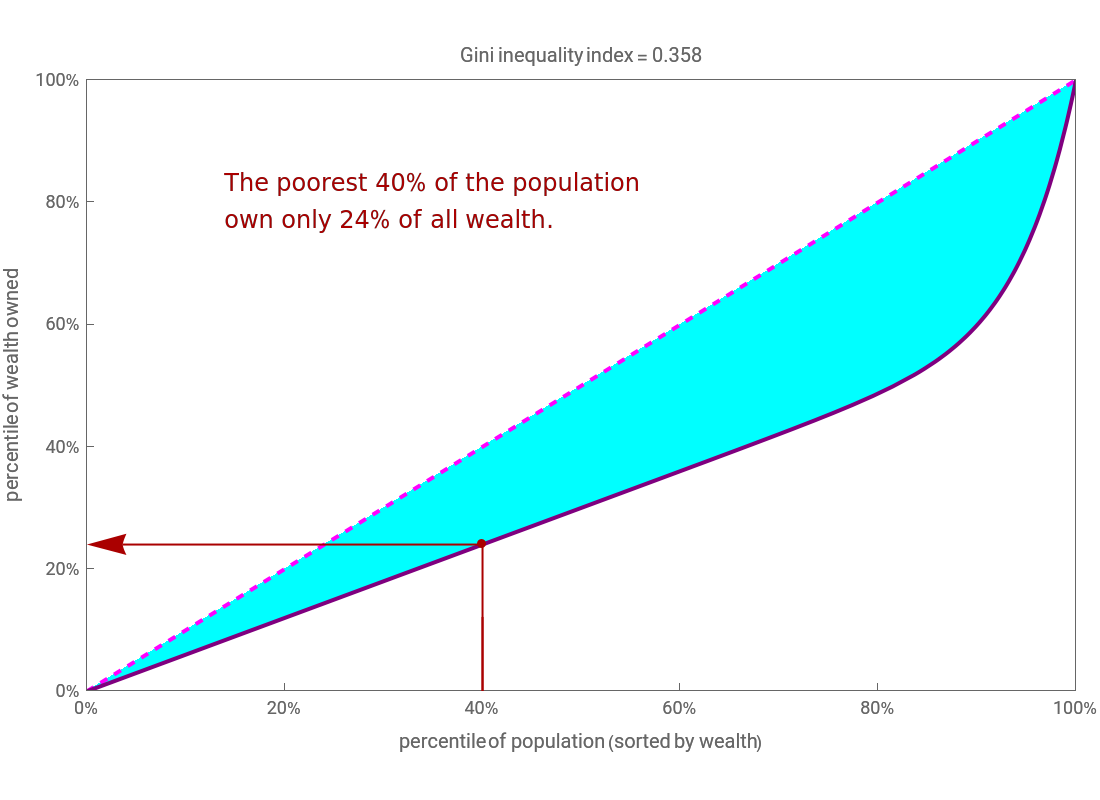
A Lorenz curve plots the cumulative percentages of total wealth owned against the cumulative number of individuals in a country, starting from the poor and going to the rich. The Gini index measures the area between the Lorenz curve and a hypothetical line of absolute equality, expressed as a fraction of the maximum area under the line. Thus a Gini index of 0 represents perfect equality, while an index of 1 represents perfect inequality. Use the sliders in this Demonstration to see that different Lorenz curves can have the same Gini index and to see what each point in a given Lorenz curve means in terms of the percentage of wealth owned by the poorest.
References
References
[1] CIA, "Country Comparison: Distribution of Family Income—Gini Index," in The World Factbook 2013–2014, Washington, DC: Central Intelligence Agency, 2013. www.cia.gov/library/publications/the-world-factbook/rankorder/2172rank.html.
External Links
External Links
Permanent Citation
Permanent Citation
José Luis Gómez-Muñoz
"The Lorenz Curve"
http://demonstrations.wolfram.com/TheLorenzCurve/
Wolfram Demonstrations Project
Published: June 2, 2014