On December 21, 2020 a visual astronomical spectacle will occur. The planet Jupiter and Saturn will pass so close to each other in the sky that, to the unaided eye, they will be difficult to separate. This is the closest the two planets have come in 397 years.
In[]:=
EmbeddedService[{"YouTube","V1C1rJh9n9w"}]
Out[]=
In[]:=
EmbeddedService[{"YouTube","TkTPfl0wwHQ"}]
Out[]=
The following view is a wide-field view computed about 6 days before the event. Due to the points size used in the graphic to represent brightness, they look larger than they actually are, but still allows the two objects to be seen as distinct. This view doesn’t show the horizon (which would be tilted in this view), but uses SkyPositionChart to center the view on specific sky coordinates where the conjunction takes place, oriented with the celestial sphere with north up. The black line is the ecliptic plane.
In[]:=
ResourceFunction["SkyPositionChart"][<|"RightAscension"Quantity[20.178,"HoursOfRightAscension"],"Declination"Quantity[-20.5372,"AngularDegrees"]|>,DateObject[{2020,12,15,18,0},TimeZone"America/Chicago"],"ShowEntityLabel"False,"EntityRadius".004,"IncludeMoon"False,"IncludeSun"False,"EntityColor"Opacity[0]]
Out[]=
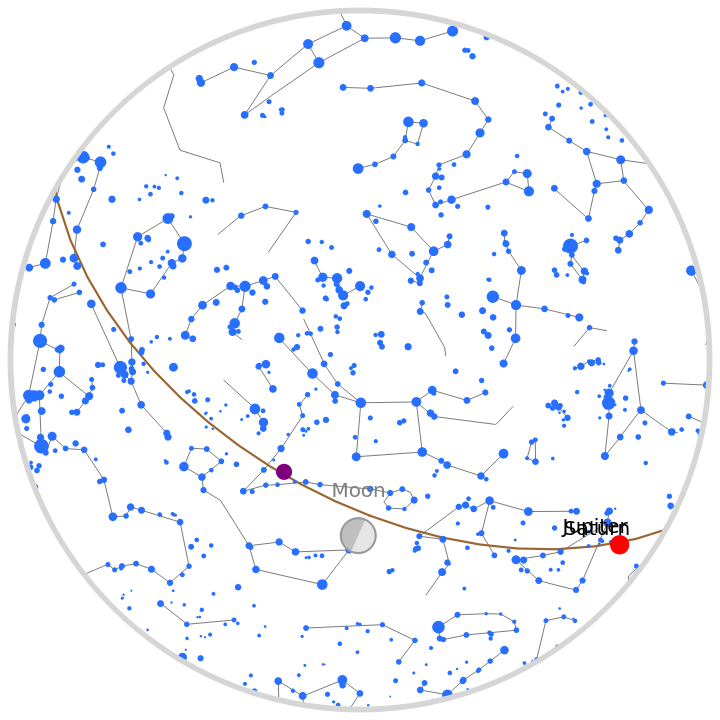
On December 16, 2020, a few days before the conjunction, the thin crescent moon Moon will be positioned near the two planets, just above the horizon, making for a very picturesque scene. As before, the black line is the ecliptic plane (not the horizon).
In[]:=
ResourceFunction["SkyPositionChart"][<|"RightAscension"Quantity[20.178,"HoursOfRightAscension"],"Declination"Quantity[-20.5372,"AngularDegrees"]|>,DateObject[{2020,12,16,18,0},TimeZone"America/Chicago"],"ShowEntityLabel"False,"EntityRadius".004,"IncludeSun"False,"EntityColor"Opacity[0]]
Out[]=
For an all sky view, we can use SkyChart to see where in the sky the event will take place, including the horizon. As can be seen, the two planets will be low in the southwest around 6 PM local time. The Moon will be high in the south and Mars high in the south southeast, just east of the Moon.
In[]:=
ResourceFunction["SkyChart"][{Entity["Planet","Jupiter"],Entity["Planet","Saturn"]},GeoPosition[{40.11,-88.22}],DateObject[{2020,12,21,18,0},TimeZone"America/Chicago"]]
Out[]=
| N | |
E | W | |
| S | |
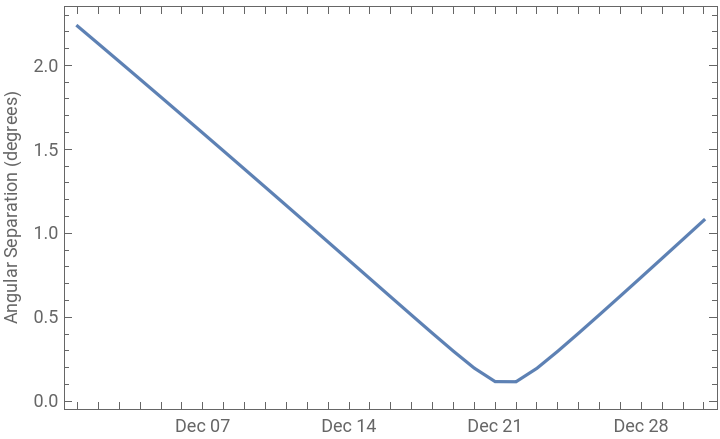
We can use AstroAngularDistance to compute the angular distance in the sky between Jupiter and Saturn throughout the month of December.
In[]:=
ts=ResourceFunction["AstroAngularDistance"][Entity["Planet","Jupiter"],Entity["Planet","Saturn"],DateRange[DateObject[{2020,12,1}],DateObject[{2020,12,31}]]]
Out[]=
TimeSeries


The resulting TimeSeries can be plotted to show that the two planets will pass within about 0.1 degrees from each other.
In[]:=
DateListPlot[ts,FrameLabel{None,"Angular Separation (degrees)"}]
Out[]=
To better understand the arrangement of the solar system during this event, we can use SolarSystemPlot3D to highlight the positions of Earth, Jupiter, and Saturn and draw lines connecting them to simulate the angle between them.
In[]:=
nov1=ResourceFunction["SolarSystemPlot3D"]Red,Sphere,.25,Sphere,.25,Sphere,.25,Line,,,,DateObject[{2020,11,1,18,0},TimeZone"America/Chicago"],PlotRange10,ViewPointAbove,BoxedFalse,ViewAnglePi6,ImageSize300;
In[]:=
dec21=ResourceFunction["SolarSystemPlot3D"]Red,Sphere,.25,Sphere,.25,Sphere,.25,Line,,,,DateObject[{2020,12,21,18,0},TimeZone"America/Chicago"],PlotRange10,ViewPointAbove,BoxedFalse,ViewAnglePi6,ImageSize300;
On November 1, as seen from Earth, Jupiter and Saturn are separated by a small angle. But on December 21, this angle becomes negligible. During this interval of time, Jupiter and Saturn move very little due to their distant orbits. Earth does most of the motion resulting in the separation angle nearly vanishing.
In[]:=
Grid[{{nov1,dec21}}]
Out[]=
 |  |
Animations
Animations
Because our usual Gregorian calendar system switches months during the period of interest, its tricky to create a smooth time iteration from start to end. So, its easier to use the Julian date which is just represented by floating point days. We can create animations from the beginning of November, through the month of December in one day increments.
In[]:=
start=JulianDate[DateObject[{2020,11,1,18,0},TimeZone"America/Chicago"]];
In[]:=
end=JulianDate[DateObject[{2020,12,31,18,0},TimeZone"America/Chicago"]];
Here is the construction of frames showing the progression of the celestial sphere variant.
In[]:=
frames1=Table[ResourceFunction["SkyPositionChart"][<|"RightAscension"Quantity[20.178,"HoursOfRightAscension"],"Declination"Quantity[-20.5372,"AngularDegrees"]|>,FromJulianDate[d],"ShowEntityLabel"False,"EntityRadius".004,"IncludeMoon"False,"IncludeSun"False,"EntityColor"Opacity[0],ImageSize{1920,1080}],{d,start,end,1}];
The result can be seen on YouTube here. YouTube often downsamples their videos so it may not look as sharp as desired.
Here is the construction of frames showing the progression of the all sky variant as seen from Champaign, IL, USA.