Import Data From EDDMaps and iNaturalist
Import Data From EDDMaps and iNaturalist
*EDDMapS (Early Detection and Distribution Mapping System)
In[]:=
$path="/Users/jofre/species-functions-and-data/Post series on Biodiversity/Stink bugs (H. halys)";SetDirectory[$path];
dataEDDMapS=SemanticImport["EDDMapS_Halys.csv"];dataiNaturalist=SemanticImport["observations-68943.csv"];
Image
Image
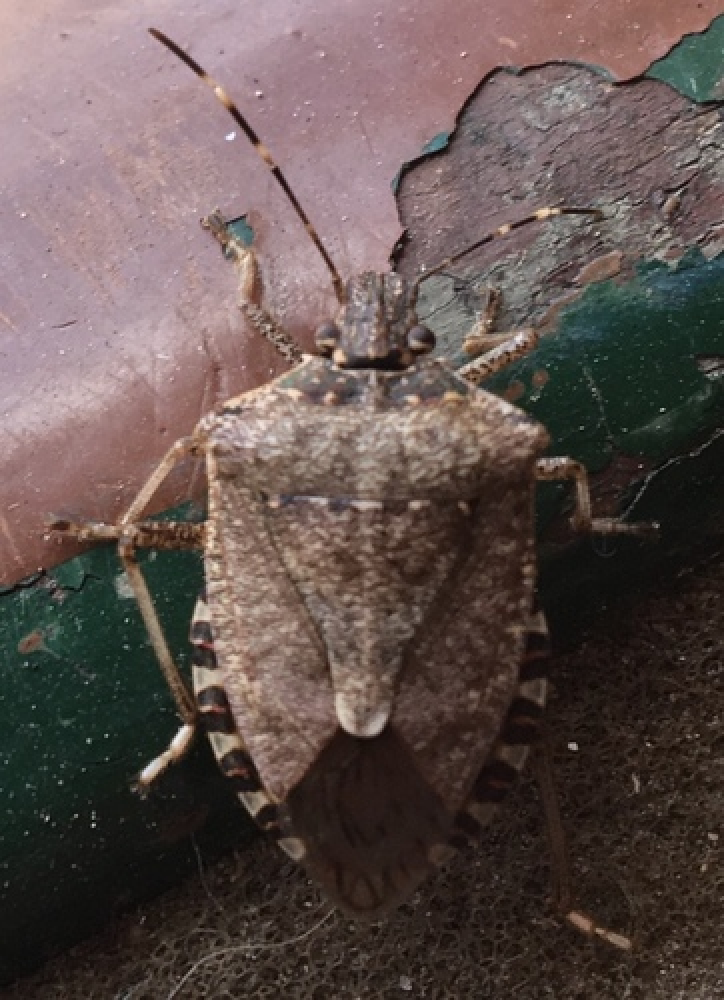
Import image of the specimen that I found in Barcelona and published in iNaturalist:
Import@First@Normal@dataiNaturalist[Select[#["user_login"]"jofree"&],"image_url"]
Code
Code
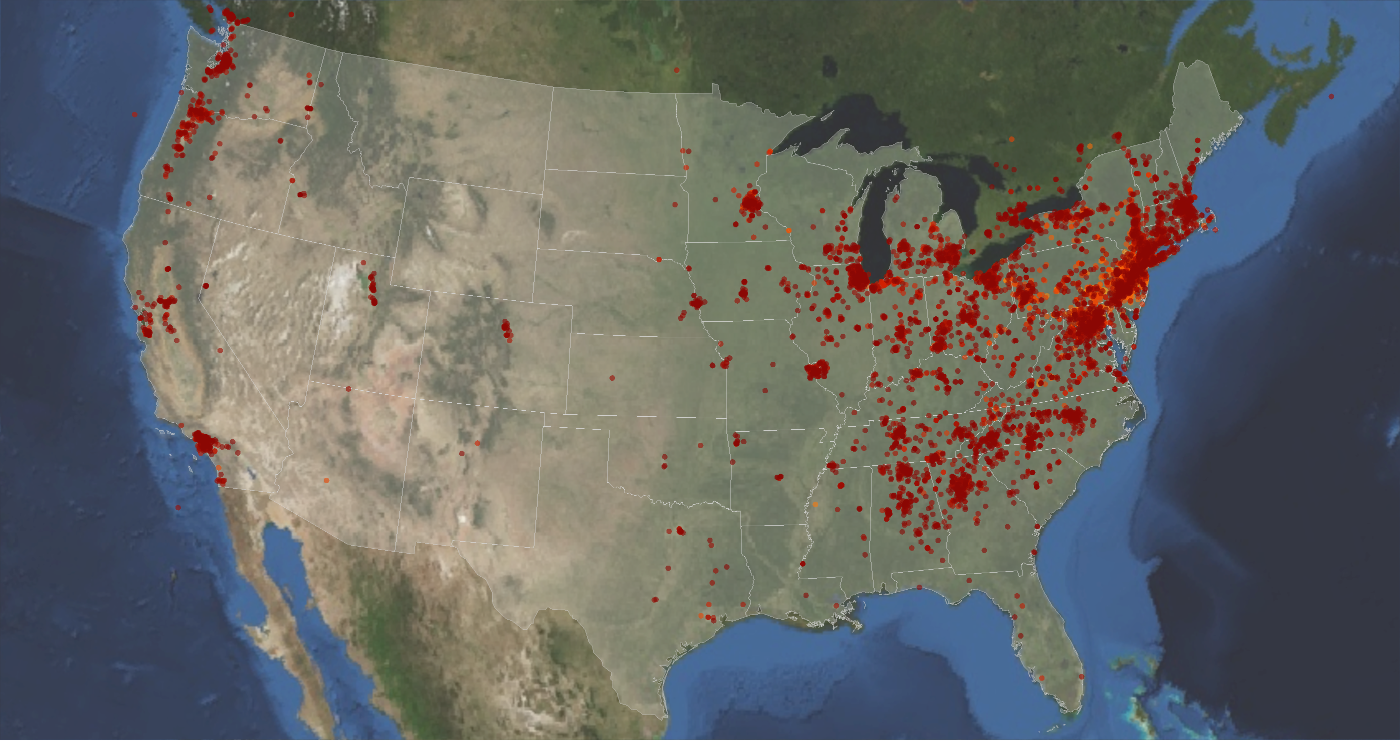
Code to visualize the distribution of the invasive stink bug over the last 20 years:
In[]:=
colorYear[year_Integer]:=Part[Reverse@Table[ColorData["SolarColors"][i],{i,0,1,0.05}],year-1998];positionsYear[year_Integer]:=GeoPosition@DeleteMissing[Join[Values@Normal@dataEDDMapS[Select[DateValue[#["ObsDate"],"Year"]==year&],{"Latitude","Longitude"}],Values@Normal@dataiNaturalist[Select[DateValue[#["observed_on"],"Year"]==year&],{"latitude","longitude"}]],1,2];distributionYear[year_Integer]:=With{yearRange=year-1998},GeoGraphicsJoinEdgeForm[{LightGray,Thin,Opacity[0.8]}],White,PolygonEntityList,Table[{colorYear[1998+y],PointSize[0.004],Opacity[0.6],Point@positionsYear[1999+y]},{y,yearRange}],GeoBackgroundGeoStyling["Satellite",Opacity[0.8]],GeoRangePadding{None,Full},GeoRange,ImageSize700

In[]:=
distributionYear[2019]
Out[]=
Create GIF
Create GIF
Create and export the GIF shown on top of the post:
In[]:=
Export["Halys_US_Distribution.gif",ParallelTable[distributionYear[1999+y],{y,20}],"DisplayDurations"0.6,"AnimationRepetitions"Infinity]
Out[]=
Halys_US_Distribution.gif
GeoSmoothHistogram
GeoSmoothHistogram
In[]:=
Clear[dataByYear];dataByYear[year_Integer]:=GeoPosition@DeleteMissing[Join[Values@Normal@dataEDDMapS[Select[DateValue[#["ObsDate"],"Year"]year&],{"Latitude","Longitude"}],Values@Normal@dataiNaturalist[Select[DateValue[#["observed_on"],"Year"]year&],{"latitude","longitude"}]],1,2];
In[]:=
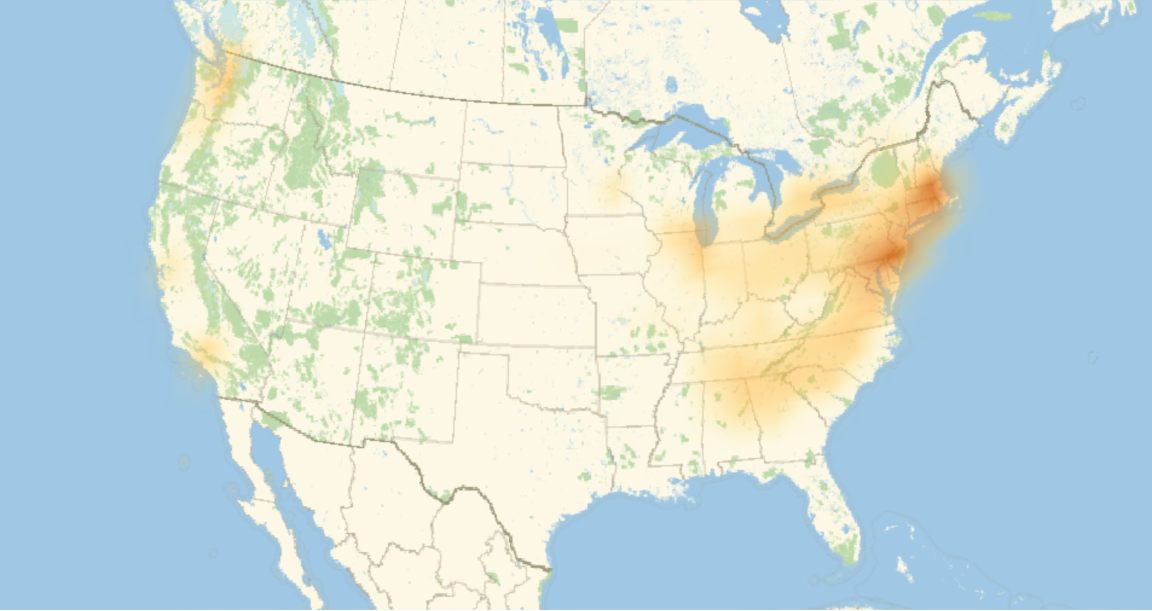
GeoSmoothHistogramdataByYear[2019],0.8,GeoRange,ImageSizeLarge
Out[]=
Date List Plot
Date List Plot
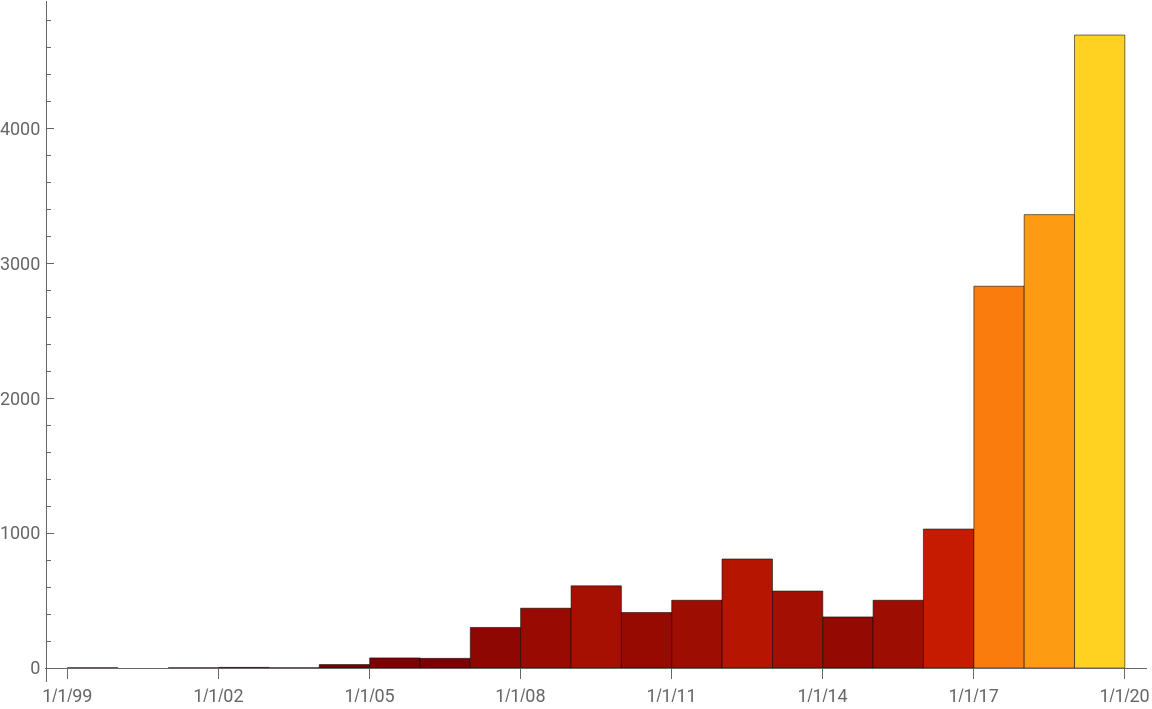
Create a DateHistogram for all observations since 1999:
observationDates=DeleteMissing[Join[Normal@dataEDDMapS[All,"ObsDate"],Normal@dataiNaturalist[All,"observed_on"]],1,2];
In[]:=
DateHistogram[observationDates,"Year",ColorFunction"SolarColors",ImageSizeLarge]
Out[]=
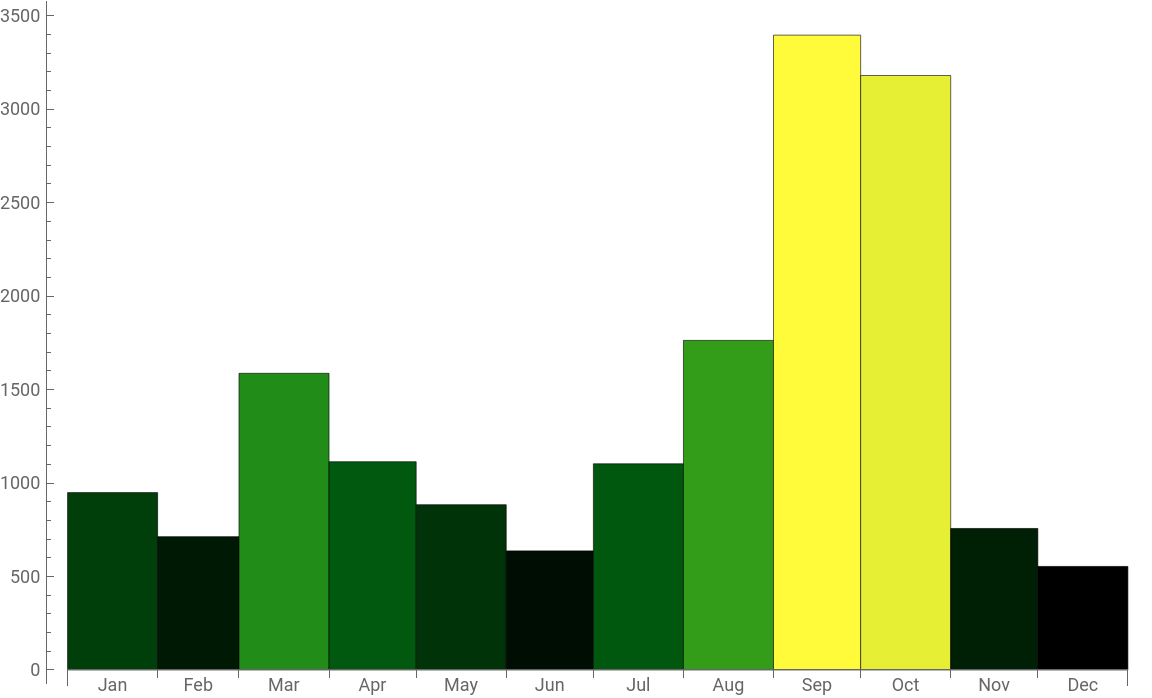
Use DateReduce to see which months the presence of this pest higher:
In[]:=
DateHistogram[observationDates,"Month",DateReduction->"Year",ColorFunction"AvocadoColors",ImageSizeLarge]
Out[]=
Other Species Built-in Data
Other Species Built-in Data
The family of stink bugs is called Pentatomidae and we can get its built-in entity by using Interpreter:
Note that Interpreter also works if you misspell a complicated name like “Pentatomidae”:
Once we have the entity of the species, we can check its associated properties, like its, “ScientificName”, and “Image”:
It is straightforward to visualize their Taxonomy Graph too: