CITE THIS NOTEBOOK: Dynamic model for world population prediction by Sangdon Lee. Wolfram Community JAN 22 2023.
1. Objectives and Summary
1
. Objectives and Summary Object: Predict the world population with decreasing birth and death rates
Object: Predict the world population with decreasing birth and death rates
I developed a dynamic model with decreasing birth and death rates in order to predict the world population and to compare my prediction with those by UN. The United Nations’ “World Population Prospects 2022” report provides long-range population projections, but but it does not typically provide information on the specific mathematical models used to generate those projections (time series regression, ARIMA, and dynamic models).
By adjusting the two growth rates for birth and death rates in my model, I am able to reproduce the UN’s “population” prediction between 2000 and 2100 using my model . By comparing my predictions to those of the UN, we can also gain insight into the uncertainty around population projections, and any areas where my model may differ from the UN’s. Additionally, we can use my model to explore different scenarios and make more specific predictions about the future population such as in certain countries. My model simulating the effects of different parameter estimates is a good way to explore how sensitive the projections are to changes in assumptions.
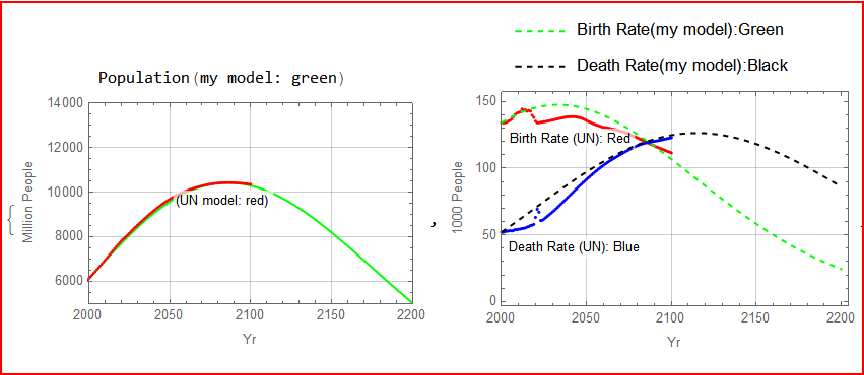
I found that it seems the UN estimates on death rates are very high. The UN is estimating that the birth rate will decline from 130 million people in 2000 to 120 million people in 2090 (about 7.6% decline) but the death rate will increase from 50 million people in 2000 to 120 million people in 2090 (about 240 % increase). It would be interesting to look into the assumptions and methods used by the UN in more detail and compare them to my own model to understand the differences in the predictions.
I found that it seems the UN estimates on death rates are very high. The UN is estimating that the birth rate will decline from 130 million people in 2000 to 120 million people in 2090 (about 7.6% decline) but the death rate will increase from 50 million people in 2000 to 120 million people in 2090 (about 240 % increase). It would be interesting to look into the assumptions and methods used by the UN in more detail and compare them to my own model to understand the differences in the predictions.
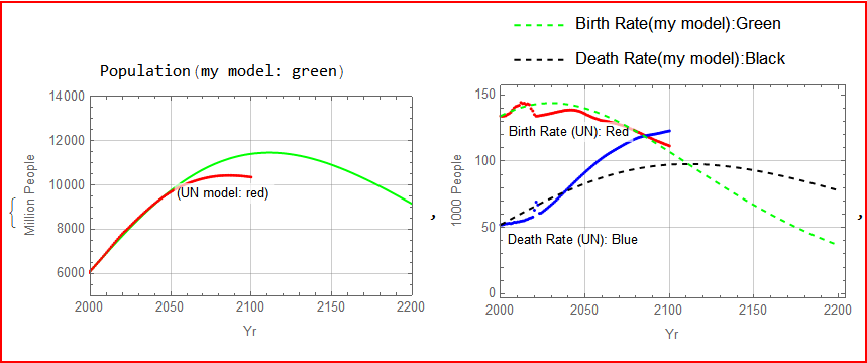
I slightly reduce the death rate from UN (i.e., the death rate will be 90 million people in 2090, instead of 120 million) and it is predicted that the world population is predicted to be 8.454 billion people in 2030, will peak at 11.411 billion people in 2100 and then start to decline. These predictions are certainly dependent on how fast the births and deaths rates are declining and my model can simulate the effects of these parameter estimates.
It is worth noting that population projections are highly dependent on the assumptions made about future trends and events and global population projections are influenced by many factors such as technological and medical advancements, economic and social developments, public policies and political stability that can change over time.
It is worth noting that population projections are highly dependent on the assumptions made about future trends and events and global population projections are influenced by many factors such as technological and medical advancements, economic and social developments, public policies and political stability that can change over time.
Main results:
Main results:
My model can estimate the population prediction by UN very well
My model can estimate the population prediction by UN very well
◼
coeffgBR = +0.0075, that is, the birth rate will decline 0.75%/year.
◼
coeffgDR= - 0.0035, that is, the death rate will decline 0.35%/year
◼
World population prediction by UN and my model as well as the birth and death rates
My prediction (Assuming lower death rate than that of UN)
My prediction (Assuming lower death rate than that of UN)
◼
coeffgBR = 0.0085 (i.e., the birth rate of gBR[2000]=0.0219 will decline 0.75%/year.
◼
coeffgDR = 0.0 (i.e., the the death rate of gDR[2000]==0.00853 will remain unchanged. Note that my estimated birth rate is lower than that of UN.
2. Dynamic World Population Model
2
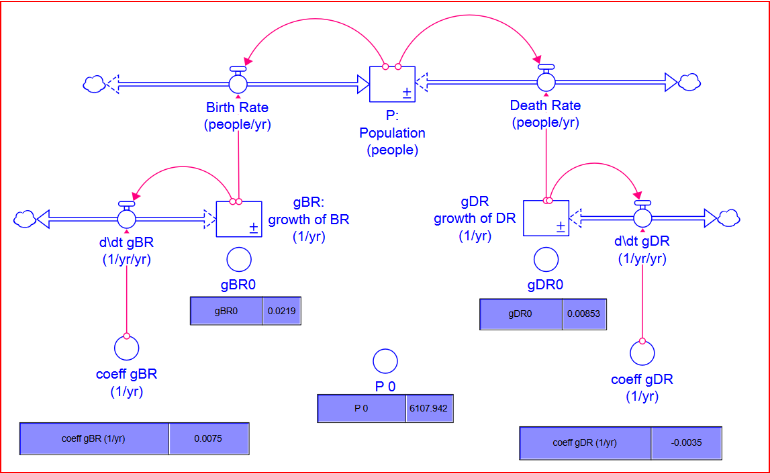
. Dynamic World Population Model Stock and flow diagram with declining birth & death rates
Stock and flow diagram with declining birth & death rates
Dynamic world population model
Dynamic world population model
In summary, the following equation can replicate the UN world population prediction between 2020 and 2100. The UN’s estimates for the birth and death rates will be somewhat different from those estimates by this dynamical model.
In summary, the following equation can replicate the UN world population prediction between 2020 and 2100. The UN’s estimates for the birth and death rates will be somewhat different from those estimates by this dynamical model.
P[t]
t
(
1
)gBR[t]
t
(
2
)gDR[t]
t
(
3
)birthRate[t]gBR[t]*P[t]
(
4
)deathRate[t]gDR[t]*P[t]
(
5
)Initial values
Initial values
◼
Simulation time for “t” is between 2000 to 2200
◼
P[2000]=Population[2000] = 6107.942 million people
◼
gBR[2000] = growth rate of birth rate
◼
gBR[2000] = 0.0219409. The initial value for the growth rate of birth rate in 2000
◼
Population in 2000 was 6107.942 million people and the death rate in 2000 was 134 million babies
In[]:=
Solve[6107.942*x134.014,x]
Out[]=
{{x0.0219409}}
◼
Note that if a stock variable is in the form of =g*X[t], then the represents the growth rate of because .
X[t]
X[t]
t
"g"
X[t]
g==≈
X[t]
t
X[t]
△X
X
◼
The same logic applies to “gBR[t]” and “gDR[t]”.
◼
gDR[2000] = growth rate of death rate = e.g., 0.00853.
◼
gDR[2000]=0.00852988. The initial value for the growth rate of death rate in 2000
◼
Population in 2000 was 6.107 billion people and the death rate in 2000 was 52.1 million people
In[]:=
Solve[6107.942*x52.100,x]
Out[]=
{{x0.00852988}}
◼
coeffgBR=growth or decline rate of the growth rate of birth rate (gBR[t])
◼
e.g., coeffgBR=0.0075 indicates that the birth rate will decline from 0.0219 in 2000 to 0.02178 in 2001 (0.75% decline per year)
◼
gBR[t]
t
◼
See the graph showing the “coeffgBR”
◼
coeffgDR[t]=growth or decline rate of growth rate of death rate (gDR[t])
◼
e.g., coeffgBR = -0.0035 indicates that the death rate will decline from 0.00853 in 2000 to 0.00856 in 2001 (0.35% decline per year)
◼
gDR[t]
t
◼
See the graph showing the “coeffgDR”
3. Terminologies and Confusions
3
. Terminologies and ConfusionsPopulation, birth rate, death rate, growth of birth rate, & growth of death rate
Population, birth rate, death rate, growth of birth rate, & growth of death rate
◼
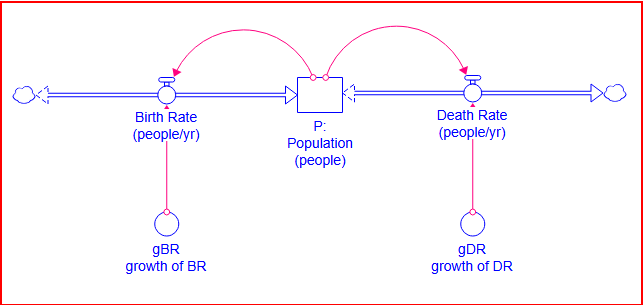
Population[t+dt]==Population[t]+(gBR*Population[t] - gDR*Population[t])*dt==Population[t]+(BirthRate[t] - DeathRate[t])*dt
◼
The growths of births and deaths are constant: the gBR and gDR are constant and they will be variables in my model: gBR[t] and gDR[t]
◼
dP[t]/dt=g*Population[t]-g*Population[t]*dt
“Population” (people)
“Population” (people)
◼
Population (stock variable) will decrease only if the birth rate (inflow) is lower than the death rate (outflow)
◼
Population has been increasing (1st graph) despite the birth rate / 1000 people has been declining.
“Birth rate” (people/year) vs. “birth rate per 1000 people” (people/year/1000)
“Birth rate” (people/year) vs. “birth rate per 1000 people” (people/year/1000)
◼
"Birth rate" is number of babies born per year (see the 2nd graph below) and remain higher than the death rate, thus as long as the birth rate is higher than the death rate, the population will increase (see the stock and flow diagram).
◼
“Birth rate per 1000 people ” has been decreasing globally since 1950 (3rd graph). The UN data calls this as “crude birth rate”. The term “crude” refers to the fact that it is a rough estimate of the number of births per 1,000 people, without taking into account the age structure of the population. Also, some other websites call this as birth rate with a correct sub-note (4th graph).
“Death rate” (people/year) vs. “death rate per 1000 people” (people/year/1000),
“Death rate” (people/year) vs. “death rate per 1000 people” (people/year/1000),
◼
Death rate is number of people passed away per year.
Confusion: “The world population will decrease because the birth rate has been declining”
Confusion: “The world population will decrease because the birth rate has been declining”
◼
Confusion: It is a fact that the “birth rate per 1000 people” has been declining since 1950 from 35 births per 1000 people in 1950 to 17 births per 1000 people in 2021. Therefore it might be incorrectly interpreted that the world population will decrease.
◼
Facts:
◼
The birth rate had been increased until 1990, remains flat until 2020, and projected to decline after 2040.
◼
The "birth rate per 1000 people" has been declining
◼
The world population has been increased from 2.5 billion people in 1950 to 7.84 billion people in 2020. The UN predicts that the world population will continue to increase to be 10.4 billion people until mid-2080.
◼
The birth rate has been higher than the death rate and the birth rate is projected to be higher than the death rate until mid-2080.
◼
Why the confusion? The confusion arises because people do not distinguish inflow, outflow and stock variables, rather than input and output variables. Births (or birth rate) are an inflow, deaths (or death rate) are an outflow, and the total population is a stock variable, an accumulation.
◼
Reducing the birth rate will not decrease population unless the birth rate (inflow) is lower than the death rate (outflow). As long as the birth rate is higher than the death rate, the population will continue to grow, but at a slower rate. The rate of population growth will be determined by the difference between the birth rate and the death rate. Declining birth rate will continue to increase the population but at a slower rate if the declining birth rate is higher than the death rate.
◼
Another confusion: “CO2 emission (tons/year) ” and “CO2 in the atmosphere (tons, but usually in ppm)”
◼
Reducing the CO2 emission (i.e., inflow) will not decrease the CO2 in the atmosphere. The atmospheric CO2 or CO2 in the atmosphere (i.e., stock variable) will continue to increase but at a slower rate. The atmospheric CO2 will decrease only if the CO2 emission is lower than the CO2 absorption or CO2 removal (i.e, outflows). Therefore “CO2 removal” is a must if we want to lower the CO2 in the atmosphere to 300 ppm. We already have pumped a lot of CO2 in the atmosphere and the CO2 absorption by nature takes hundreds or thousands years to remove the CO2.
◼
The best analogy I can think of is this. Let’s say we are traveling from Detroit to NewYork at 70 mph and then have to reduce the speed to 50 mph due to traffic, the distance traveled will continue to increase but at a slower rate, not as fast as we are traveling at 70 mph.
Import the dataset
Import the dataset
◼
the analytical dataset is provide next.
{year, population, birth, crude birth rate, deaths, crude death rate}
Birth rate data from UN
Birth rate data from UN
“year”, “birth rate (million babies/year)”. e.g., 92.083 million babies were born in 1950
“year”, “birth rate (million babies/year)”. e.g., 92.083 million babies were born in 1950
◼
The birth rate had been increased to 1990, remain flat until 2040, and then projected to decline after 2040
Population data from UN
Population data from UN
“year”, “population (people)”. e.g., the world population in 1950 was 2.477 billion people
“year”, “population (people)”. e.g., the world population in 1950 was 2.477 billion people
◼
The UN projection of world population
Death rate from UN
Death rate from UN
“year”, “death rate (people/year)”. e.g., 48.788 million people passed away in 1950
“year”, “death rate (people/year)”. e.g., 48.788 million people passed away in 1950
◼
Observed death rate until 2021, predicted death rate after 2022
◼
The death rate will increase from 60 million people in 2020 to120 million in 2080. The doubling time is 60 years from 2020 to 2080 so the annual increase is 83% per year, which does seem unrealistically high. I will lower this death rate from 120 to 100 million people.
Un’s world population, birth rate and death rate together
Un’s world population, birth rate and death rate together
◼
birth rate >> death rate until mid-2080
◼
Note that the birth rate will double from 60 million people in 2020 to 120 million in 2080 (i.e., 200 % increase), while the birth rate will decrease 130 million babies in 2020 to 120 million babies in 2080 (i.e., 8% decrease).
Crude Births & Deaths per 1000 population
Crude Births & Deaths per 1000 population
◼
Crude birth rate (births per 1000 population) and Crude death rate (deaths per 1000 population) have been declining
ParametricNDSolve[]
ParametricNDSolve[]
Manipulate[] and predict the population in 2200
Manipulate[] and predict the population in 2200
◼
The “population” prediction by UN can be well estimated using coeffgBR = +0.0075, and coeffgDR=-0.0035
◼
I used coeffgBR = +0.0085, and coeffgDR= 0.00 to estimate the “birth and death rates” because the death rate estimate by UN seems to high
◼
My prediction model is able to reproduce the world population prediction by UN extremely well.
◼
UN predicts the world population to be 8.4 billion people in 2030, peak at 10.4 billion people in 2090 and then decline, which can be well estimated by this model using the 0.0075 & - 0.0035 for the growth rates of birth and death rates, respectively
◼
My model predicts the world population will reach 8.5 billion people in 2030, peak at 11.4 billion people in 2100 and then decline. I am assuming that the death rate estimate used by UN model seems too high and I am using 0.0085 & 0.0000 for the growth rates of birth and death rates, respectively to make this prediction.
◼
The birth rate is predicted to be lower than the death rate around mid-2080, thus the population will continue to increase until mid-2080 and then decline
◼
Increase the tMax from 2100 to 2500 and this model becomes unstable after the year 2300. However, I checked this model using a software called Stella and I find that the simulation model is stable even if tMax is longer than 2300. May need to specify an integration method in the ParametricNDSolve[](??)
◼
Compare the dynamic model vs Time Series Regression model and ARIMA-type model. Compare the regression coefficients from time series regression. We need to be very careful about the regression equation unless we will have coefficients opposite of common sense such as increasing birth rate will have a negative regression coefficient.
The coeffgBR = 0.0075 and coeffgDR = -0.0035 can replicate the world population prediction by UN but the birth and death rates are quite different between UN estimates and my model' s estimates . My model shows the birth rate is much higher and death rate is much lower .
Compare my model with UN estimation
Compare my model with UN estimation
My prediction with lower death rate that that of UN
My prediction with lower death rate that that of UN
Data source from UN
Data source from UN
◼
UN:
◼
The number of births at 2050 are around 135 million babies
◼
The number of deaths at 2050 are around 90 million people
The UN data are also available in other websites
The UN data are also available in other websites
◼
Population
◼
The world population was 7.76 billion people in 2020 and passed 8 billion in 2022
◼
Birth rate
◼
Birth rate per 1000 people
◼
Death rate
Comparison with the Earth4All model
Comparison with the Earth4All model
Too little too late scenario (e.g., business as usual) from the Earth4All model
Too little too late scenario (e.g., business as usual) from the Earth4All model
◼
“Earth4All model” is the latest update of the “limits to growth model”
◼
The population will peak around mid-2050, while UN predicts population will peak mid-2080.
Dimension analysis
Dimension analysis
◼
Population: people
◼
Birth Rate (BR) : people/year
◼
Death Rate (DR): people/year
◼
Population(t+dt)=Population(t) +(BR(t)-DR(t))*dt =Population(t) +(gBR(t)*Population(t)-gDR(t)*Population(t))*dt
Growth rate of Birth Rate (Births/year) and Death Rate (or Deaths/year): gBR(t) and gDR(t)
Growth rate of Birth Rate (Births/year) and Death Rate (or Deaths/year): gBR(t) and gDR(t)
Growth rate of gBR(t) and gDR(t)
Growth rate of gBR(t) and gDR(t)
◼
gBR(t+dt)=gBR(t)+coeffgBR*gBR(t)*dt
Estimate the initial values using UN data
Estimate the initial values using UN data
◼
gBR[2000]
◼
gDR[2000]
Screen shots of UN data (cleaned)
Screen shots of UN data (cleaned)
Symbolic solution
Symbolic solution
The UN predictions can be expressed with the following symbolic equations
The UN predictions can be expressed with the following symbolic equations
◼
“t” is between 2000 and 2100
Symbolic solution using DSolve[]
Symbolic solution using DSolve[]
◼
The symbolic solution matches with the numeric solution
Numeric solution using NDSolve[]
Numeric solution using NDSolve[]
Time series “regression” models
Time series “regression” models
Time Series Regression Model 1: deltaYt = Y(t)-Y(t-1) = b1**BirthRate - b2*DeathRate
Time Series Regression Model 1: deltaYt = Y(t)-Y(t-1) = b1**BirthRate - b2*DeathRate
◼
Note that the above model is equivalent to the dynamic population model
◼
deltaYt = Y(t)-Y(t-1) = b1**BirthRate - b2*DeathRate ==> Y(t) = Y(t-1)+ (b1**BirthRate - b2*DeathRate )
◼
predict the population at the end of 2023