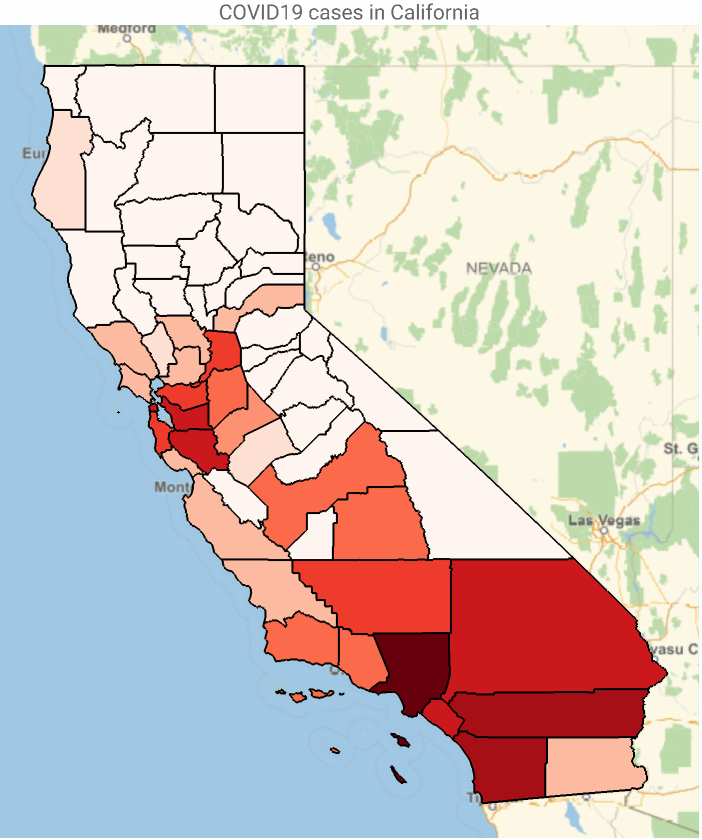
The COVID19 epidemic data of US counties can be retrieved from Wolfram Data Repository. Note that this dataset is updated daily, by curating the JHU data. In this very short essay, I show how to get county data and do some visualizations.
If you are retrieving the epidemic data on daily bases, I suggest erasing the resource object, to avoid any potential issue with cached data.
Get COVID19 epidemic data from WDR, select California counties
In[]:=
DeleteObject[ResourceObject["Epidemic Data for Novel Coronavirus COVID-19"]];coCases=ResourceData["Epidemic Data for Novel Coronavirus COVID-19","USCounties"]Select#State==&,{#County,#ConfirmedCases["LastValue"]}&//Normal;
For coloring and legend, I borrowed some ideas from this community post. In other to figure out how to set limits of bins, one can get some hints from the following code.
Generate list of histogram bins and their heights from the number of confirmed cases, put them in the format of {bin range,height} and return bins with nonzero height:
In[]:=
Select[Transpose[{Partition[First[#],2,1],Last[#]}]&@HistogramList[coCases〚All,2〛],Last[#]>0&]
Out[]=
{{{0,500},46},{{500,1000},4},{{1000,1500},3},{{1500,2000},2},{{2000,2500},1},{{2500,3000},1},{{16000,16500},1}}
Choose 9 color bins, assign corresponding value ranges, and define a color function
In[]:=
colors=ResourceFunction["ColorBrewerData"]["Reds",9];bins={50,100,200,300,500,1000,2000,5000};cfunc[x_]:=Which@@Riffle[Join[x≤#&/@bins,{x>Last[bins]}],colors]
Define legends based on color bins and corresponding values:
In[]:=
legend=SwatchLegend[colors,ToString/@Join[{"<"<>ToString@First[bins]},ToString@#1<>"-"<>ToString@#2&@@@Partition[bins,2,1],{">"<>ToString@Last[bins]}],LegendMarkersGraphics[{EdgeForm[Black],Opacity[1],Rectangle[]}],LegendLabel"Confirmed Cases",LegendFunction(Framed[#,RoundingRadius5]&),LegendMargins5];
Color geo-regions using color bins defined before, and label regions by their name and number of confirmed cases:
In[]:=
Legended[GeoGraphics[{EdgeForm[Black],{GeoStyling[cfunc[#2]],Tooltip[Polygon[#1],Column[{StringDelete[CommonName[#1],", California, United States"],#2}]]}&@@@coCases},PlotLabel"COVID19 cases in California"],legend]
Out[]=