Plant Pathogen and Hyperparasite Annual Cycle
Plant Pathogen and Hyperparasite Annual Cycle


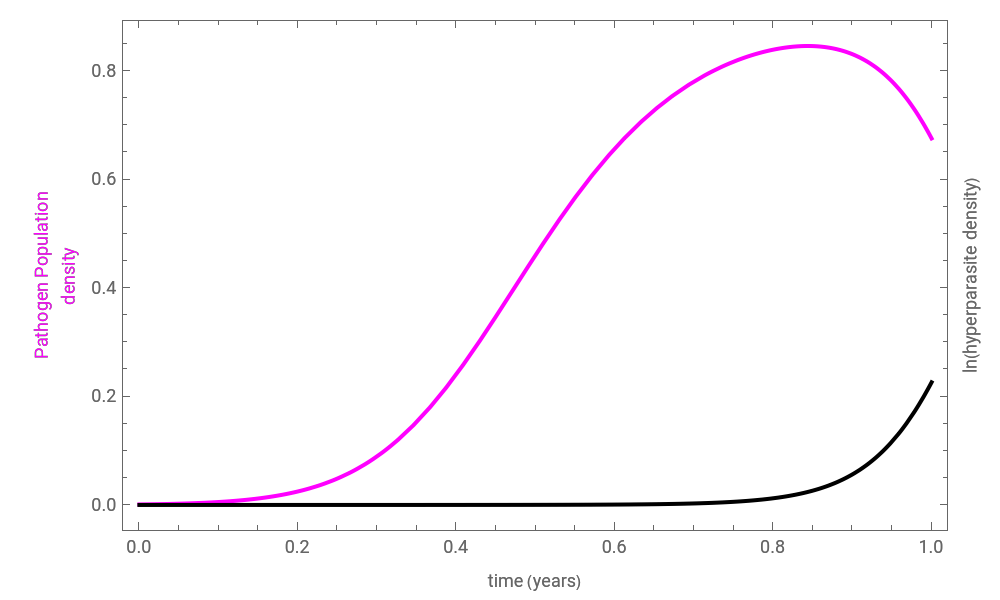
This Demonstration shows the annual cycle of a population of a plant pathogen that is itself attacked by a hyperparasite. The pathogen increases at a per capita rate that is reduced in proportion to the population size and decreases during the season as conditions become progressively unfavorable. It is destroyed by a hyperparasite at a rate that is proportional to both populations. The growing season is assumed to be 180 days. The hyperparasite harms the pathogen and multiplies by destroying it, but has no in-season death rate. This models something with long-lived structures but only one food source.
Details
Details
If the pathogen population as a proportion of its maximum is and the population of the hyperparasite is , and both are functions of time , the equations governing the changes in time are:
h
s
t
dh
dt
r
h
ds
dt
h(0)=
h
0
s(0)=
s
0
Permanent Citation
Permanent Citation
Michael Shaw
"Plant Pathogen and Hyperparasite Annual Cycle"
http://demonstrations.wolfram.com/PlantPathogenAndHyperparasiteAnnualCycle/
Wolfram Demonstrations Project
Published: March 7, 2011