ABSTRACT (original article): The fundamental aspect of physics of ferroelectric materials is the screening of uncompensated bound charges by the dissociative adsorption of ionic charges from the environment. The adsorption of ions can be especially strong when the ferroelectric undergoes the temperature-induced transition from the paraelectric phase to the ferroelectric state. We demonstrated that the adsorption of ions and free radicals by the polar surface of ferroelectric nanoparticles can be very efficient in aqueous solutions due to the strong ferro-ionic coupling in the nanoparticles. Obtained results can be useful for the elaboration of alternative methods and tools for adsorption of the cations , , Na+, etc.), anions (Cl, Br, J), and/or free radicals (CO, , etc.) from aqueous solutions by the lead-free uniaxial ferroelectric nanoparticles. The results may become an alternative way for the environment-friendly laboratory-scale purification of different aqueous solutions from ionic contamination using controllable cyclic temperature variations. CITATION (original article): Eugene A. Eliseev, Sergei V. Kalinin, Anna N. Morozovska (2025), Adsorption of ions from aqueous solutions by ferroelectric nanoparticles, Phys. Rev. Applied 23, 014081. https://doi.org/10.1103/PhysRevApplied.23.014081
(
+
Li
+
K
+
NH
4
Definitions
Definitions
Function to construct analytic phase diagram
Function to construct analytic phase diagram
Logarithmic ticks-marks for plots
Logarithmic ticks-marks for plots
Figures
Figures
Global value of ions activation energy (eV)
In[]:=
ΔG=0.04;
Estimations
Estimations
Diagrams
Diagrams
Screening length, λ(T, an), dependence on temperature and activity. Figures 2a, 2b and 4e
Screening length, λ(T, ), dependence on temperature and activity. Figures 2a, 2b and 4e
a
n
Figure 2a : screening length dependence on temperature and activity values
ContourPlotMin246T+273,"lambda",R->1*,an->,dG1->ΔG,dG2->ΔG,{T,0,100},{lga,-2,0},
10
10
-9
10
lga
10
Out[]=
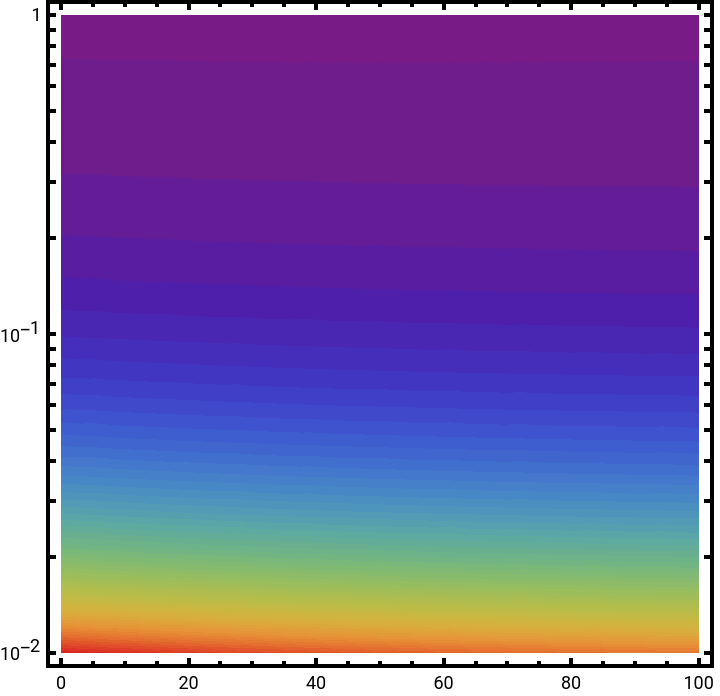
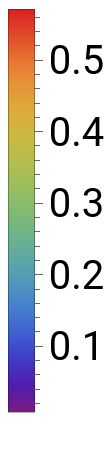
Figure 2b : screening length dependence on activation energy and activity values
Troom=25;ContourPlotMin246Troom+273,"lambda",R->1*,an->,dG1->dG,dG2->dG,{dG,0.01,0.10},{lga,-2,0},
10
10
-9
10
lga
10
Out[]=
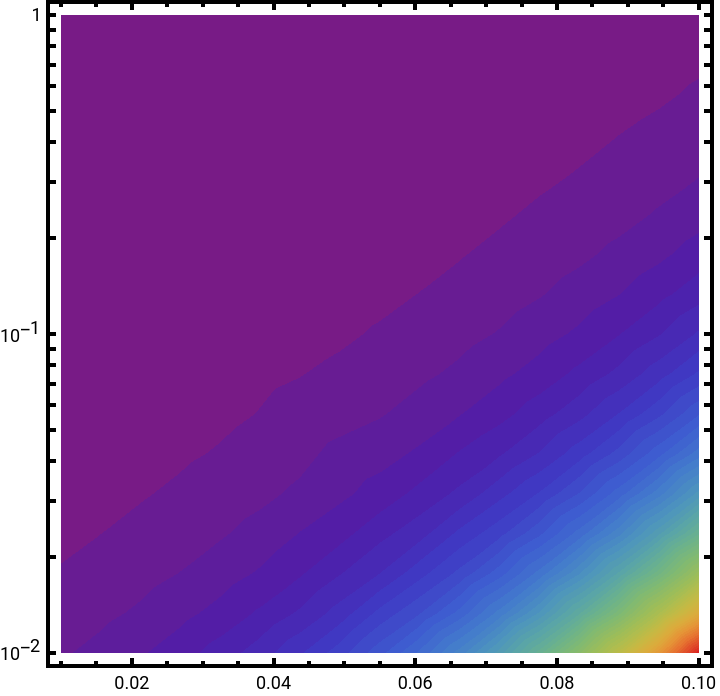

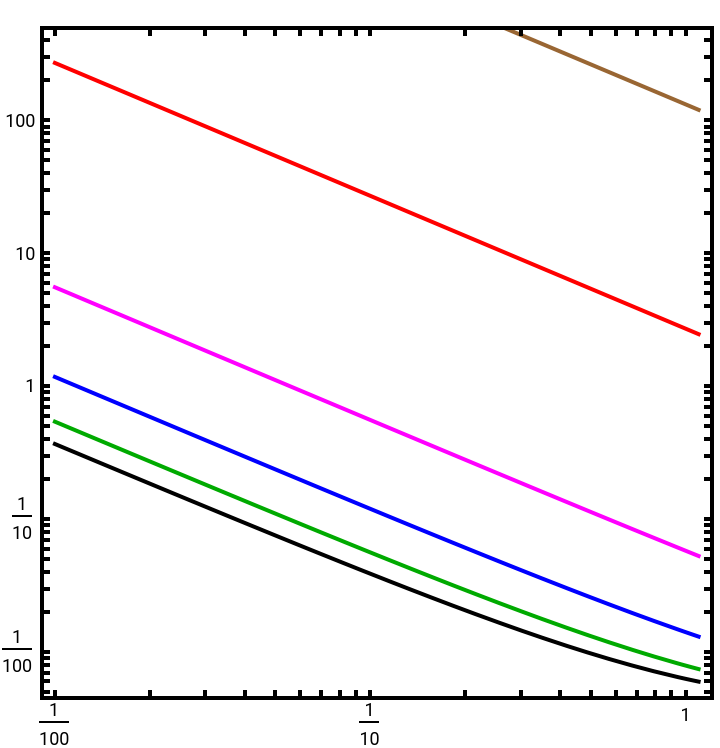
Figure 4e : screening length dependence on activity at fixed of temperature values T = 298 K
Troom=25;dg0=0.03;dg1=0.04;dg2=0.06;dg3=0.1;dg4=0.2;dg5=0.3;rr=1;Fct=;LogLogPlotFct*Min246Troom+273,"lambda",R->rr*,an->nn,dG1->dg0,dG2->dg0,Fct*Min246Troom+273,"lambda",R->rr*,an->nn,dG1->dg1,dG2->dg1,Fct*Min246Troom+273,"lambda",R->rr*,an->nn,dG1->dg2,dG2->dg2,Fct*Min246Troom+273,"lambda",R->rr*,an->nn,dG1->dg3,dG2->dg3,Fct*Min246Troom+273,"lambda",R->rr*,an->nn,dG1->dg4,dG2->dg4,Fct*Min246Troom+273,"lambda",R->rr*,an->nn,dG1->dg5,dG2->dg5,{nn,0.01,1.1},
10
10
-9
10
-9
10
-9
10
-9
10
-9
10
-9
10
Out[]=
Polarization Ps dependence on temperature and activity ( (T,an)-map) at fixed radius R values, Figure 3a and different ΔG1,2 values (supplement)
Polarization dependence on temperature and activity ( )-map) at fixed radius R values, Figure 3a and different values (supplement)
P
s
(T,
a
n
ΔG
1,2
Color maps of the spontaneous polarization dependence on temperature and activity
Figure 3a : radius R = 50 nm
Rp=50;ContourPlotMin246T+273,"OrderParameter",R->Rp*,an->,dG1->ΔG,dG2->ΔG,{T,0,72},{lga,-3,0},
-9
10
lga
10
Out[]=
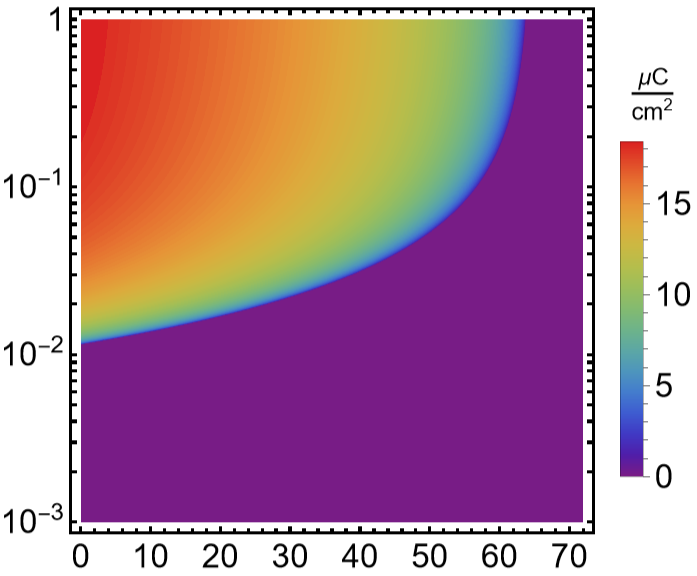
Figure S1a : radius R = 25 nm, small values of =0.01 eV
ΔG
i
Rp=25;ContourPlotMin246T+273,"OrderParameter",R->Rp*,an->,dG1->0.01,dG2->0.01,{T,0,75},{lga,-3,0},
-9
10
lga
10
Out[]=
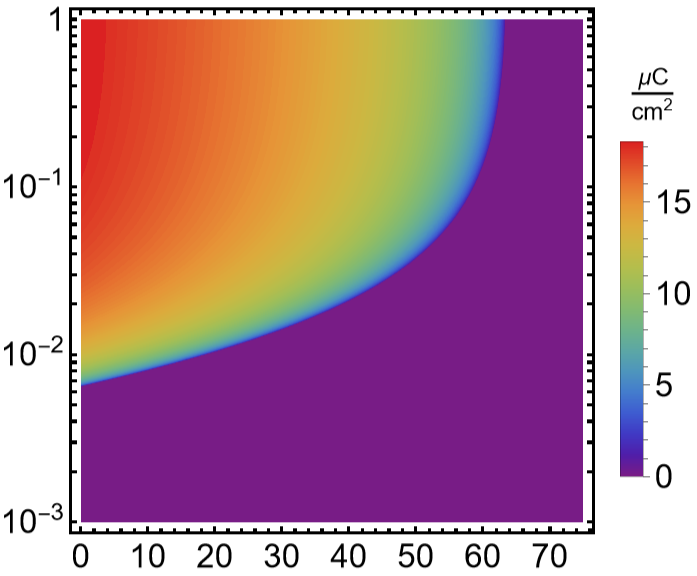
Figure S1b : R = 25 nm, higher values of =0.1 eV
ΔG
i
Rp=25;ContourPlotMin246T+273,"OrderParameter",R->Rp*,an->,dG1->0.1,dG2->0.1,{T,0,75},{lga,-3,0},
-9
10
lga
10
Out[]=
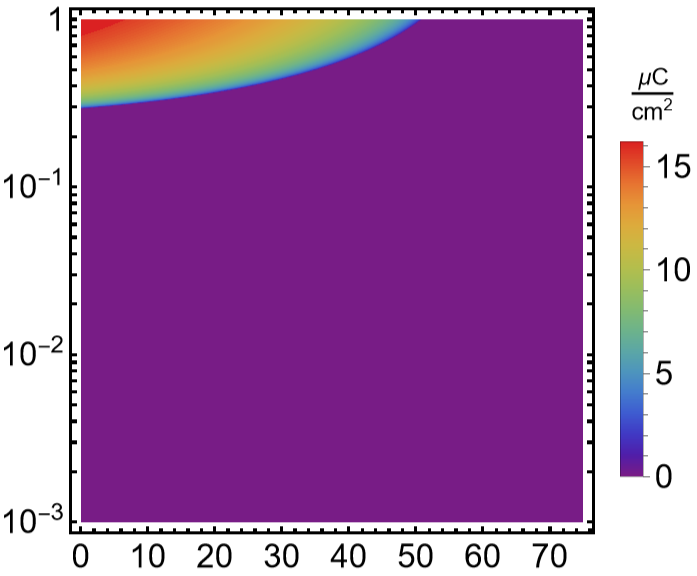
Color map of the spontaneous polarization dependence on radius and activity at room temperature
Figure 4f, polarization dependence on the activity, at R = 25 nm, room temperature and different activation energy values
Color map of the spontaneous polarization dependence on activation energy and activity at room temperature and radius R = 50 nm
Color map of the spontaneous polarization dependence on the radius and temperature for fixed values of activation energy 0.04 eV and activity 0.1
CITE THIS NOTEBOOK
CITE THIS NOTEBOOK