Liquid-Liquid Extraction (LLE) on a Right-Triangle Ternary Phase Diagram
Liquid-Liquid Extraction (LLE) on a Right-Triangle Ternary Phase Diagram

This Demonstration shows how to use the Hunter–Nash method on a right-triangle ternary phase diagram.
Check "grid lines" to show grid lines on the diagram. Check "carrier compositions" to show the carrier mass fractions on the diagram.
The Hunter–Nash method uses material balances and a ternary phase diagram with phase separation to determine the number of equilibrium stages needed for liquid-liquid extraction (LLE). The solvent mass flow rate and the desired raffinate (refined product) composition are given.
R
N
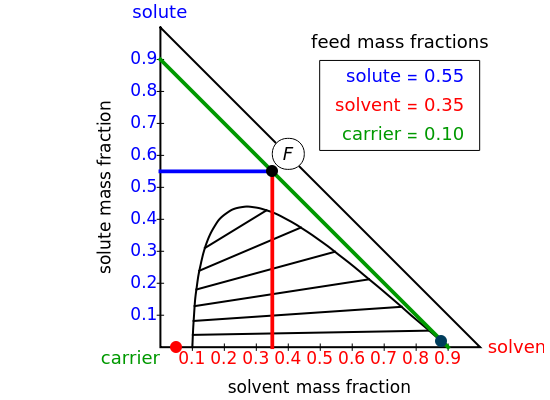
Select "plot points" and then drag the black feed point (labeled with a circled ) to a desired feed composition within a restricted range of compositions. Use buttons to view the compositions of the feed , solvent or raffinate in the solute (blue), solvent (red) and carrier (green) phases. Select "mixing point" to see how the mixing point and the extract composition in the first stage are determined. Check "show " to show the extract composition. Next, select "operating point" to show how the operating point is found. This also displays a schematic of the flow system and mass balances. The operating point is used to determine the number of stages. Finally, select "count stages" to use the "draw tie lines" slider to determine the number of stages and the extract and raffinate compositions in each stage. The solid orange lines follow the black tie lines, and the dashed blue lines trace back to the operating point. A diagram of the stages is shown above the ternary phase diagram.
F
F
S
R
N
M
E
1
E
1
P
Details
Details
The feed composition is selected within a narrow range of compositions, but the solvent composition and the desired raffinate composition are specified. The extract composition and the number of stages to obtain the desired raffinate composition are determined by mass balances. First, the composition of the mixing point is calculated and located on the ternary phase diagram. The mixing point corresponds to the composition that would be obtained if the feed and the solvent flows were mixed together.
The mixing point is located on the phase diagram between the feed and solvent points:
M
M=+
F
x
S
x
2
where and are the feed and solvent compositions.
F
x
S
x
A line is drawn from the desired raffinate composition through the mixing point until it intersects the phase boundary; this gives the extract composition leaving stage 1.
R
N
E
1
The operating point is located at the intersection of a line drawn through points and and a line drawn through and because the overall mass balance for the system is:
P
F
E
1
R
N
S
F+S=+
E
1
R
N
This equation is rearranged to determine the operating point:
P=-F=-S
E
1
R
N
A tie line from to the right side of the phase boundary yields the raffinate composition leaving stage 1; this line represents the first equilibrium stage (orange).
E
1
R
1
A mass balance in stage 1 (total feed in = total feed out) is:
E
2
E
1
R
1
which can be written as:
E
2
R
1
E
1
Thus, the extract composition leaving stage 2 is found by drawing a straight line from to (because from the previous equation). Where this line intersects the left side of the phase boundary is the composition of .
E
2
R
1
P
P+=
R
1
E
2
E
2
This procedure is repeated for additional stages until the raffinate composition is nearly equal to the desired value without being less than . The number of orange equilibrium lines drawn is the number of equilibrium stages needed to obtain .
R
N
R
N
R
N
See[1–4] for screencasts that describe the Hunter–Nash method and present examples.
References
References
[1] Hunter–Nash Method: Liquid-Liquid Extraction[Video]. Retrieved July 31, 2017, from www.youtube.com/watch?v=e0Yt5RMkyj4.
[2] Hunter–Nash Method: Liquid-Liquid Extraction Example[Video]. Retrieved July 31, 2017, from www.youtube.com/watch?v=FaKIZU3XPR8.
[3] Hunter–Nash Method 1: Mixing and Operating Points[Video]. Retrieved July 31, 2017, from www.youtube.com/watch?v=-yW0jIcH0_E.
[4] Hunter–Nash Method 2: Number of Stages[Video]. Retrieved July 31, 2017, from www.youtube.com/watch?v=JZuavrt8ksQ.
External Links
External Links
Permanent Citation
Permanent Citation
Rachael L. Baumann, John L. Falconer
"Liquid-Liquid Extraction (LLE) on a Right-Triangle Ternary Phase Diagram"
http://demonstrations.wolfram.com/LiquidLiquidExtractionLLEOnARightTriangleTernaryPhaseDiagram/
Wolfram Demonstrations Project
Published: September 8, 2017