Out[]=
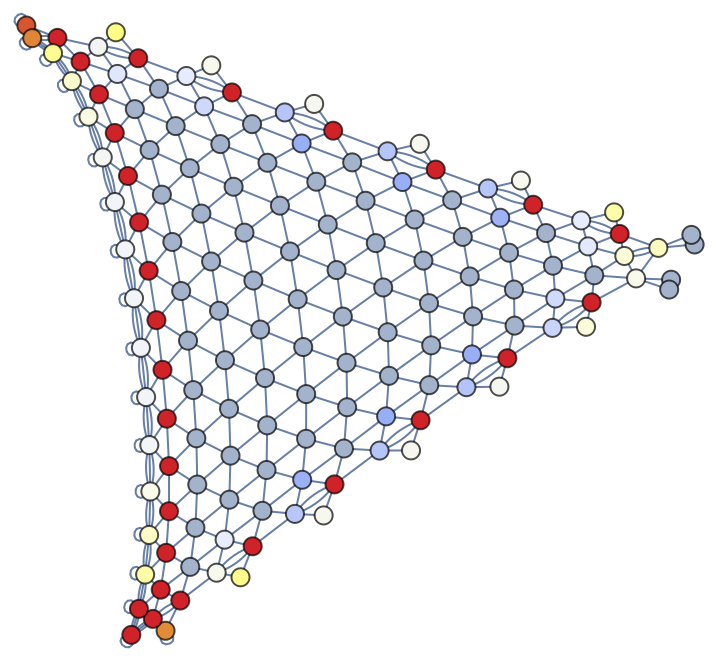
Investigate Dimension Estimation Algorithm and Dimension Tensor in Wolfram Physics Model
Zhenzhong (Jack) Xing
Grinnell College
Zhenzhong (Jack) Xing
Grinnell College
By measuring a geodesic tube’s growth rate, a dimension estimation algorithm for a specific projection in a graph is developed based on previous functions, hoping to provide information about dimensionality in different directions. This algorithm is applied to multiple (hyper) graphs, from which some common phenomena of dimension tensor have been observed. Observations of dimension tensors in graphs also inspire a very primitive mathematical description of discrete dimension system, with more need to be considered in the future.
Introduction
Introduction
There are many ways to interpret dimensionality in the ordinary physics world, where continuous manifold always have integer dimension. For example, in three-dimensional Euclidean space, we use (x, y, z) as coordinates, where the dimension is the number of least variables we need to describe any given location. We can also calculate the dimension through the log difference of “spatial” expansion. For instance, the area of a circle in a two-dimensional plan grows as r^2, while the volume of a sphere in a three-dimensional space grows as r^3. These examples suggest that dimension determines how space expands or, in other words, where an object can move.
Things are a bit different in our physics model because, instead of having a smooth manifold, space is discrete, and locations are connected through edges. An analogy would be: at some points, object A can move in x, y, and z directions; at some other points, object A can only move in x and y directions. This indicates that dimension is no longer a ubiquitous property throughout the space and different locations have various possibilities for an object to travel in different directions. Therefore, in our model, a dimension tensor is worth investigating for both local and global behavior.
Method
Method
The dimension for a specific projection in a graph can be calculated using:, which is the same as ,where volume is the number of vertices within a geodesic tube between and of radius ; is dimension projection; for simplicity, is the distance between and .
Vol(r)=l
d-1
2
π
Γ
d+1
2
d-1
r
d=
log(Vol(r+1))-log(Vol(r))
log(r+1)-log(r)
Vol(r)
vertex
1
vertex
2
r
d
l
vertex
1
vertex
2
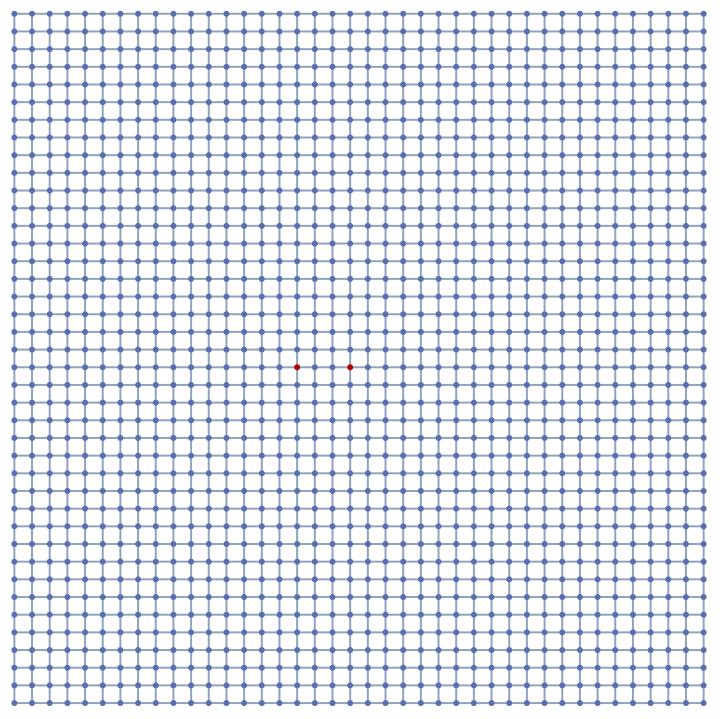
For example, if we were to calculate the dimension projection from vertex 660 to vertex 780 in a 40×40 grid graph.
40*40 grid graph with vertex 660, 780 highlighted
Out[]=
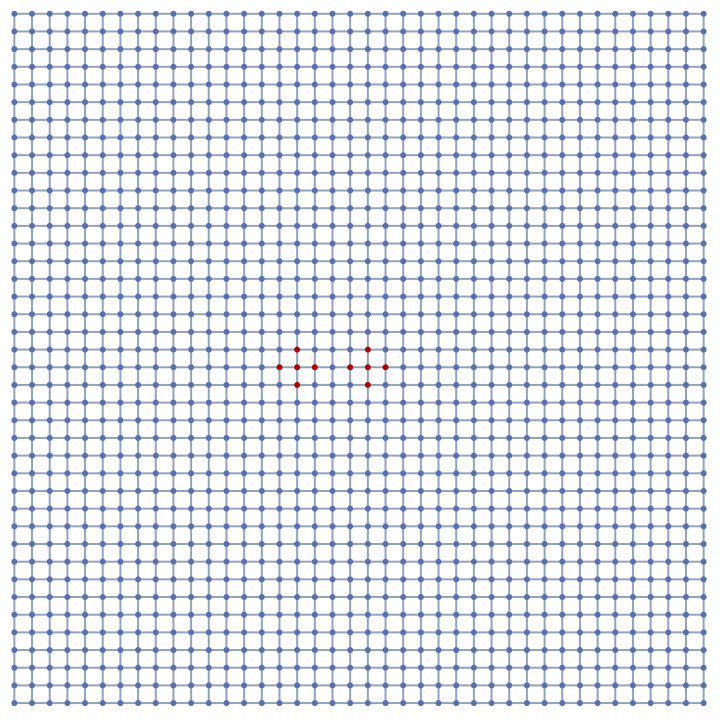
When radius is set to 2, the initial ball includes every vertex within 1 edge from vertex 660 and the final ball includes every vertex within 1 edge from vertex 820.
40*40 grid graph with vertices with one step from vertex 660, 780 highlighted
Out[]=
For each pair of vertices - one from the initial ball and the other from the final ball - find out all the geodesics between them, and mark the vertices in these geodesics.
Geodesic tube from vertex 660 to 780 with radius two and three
Out[]=
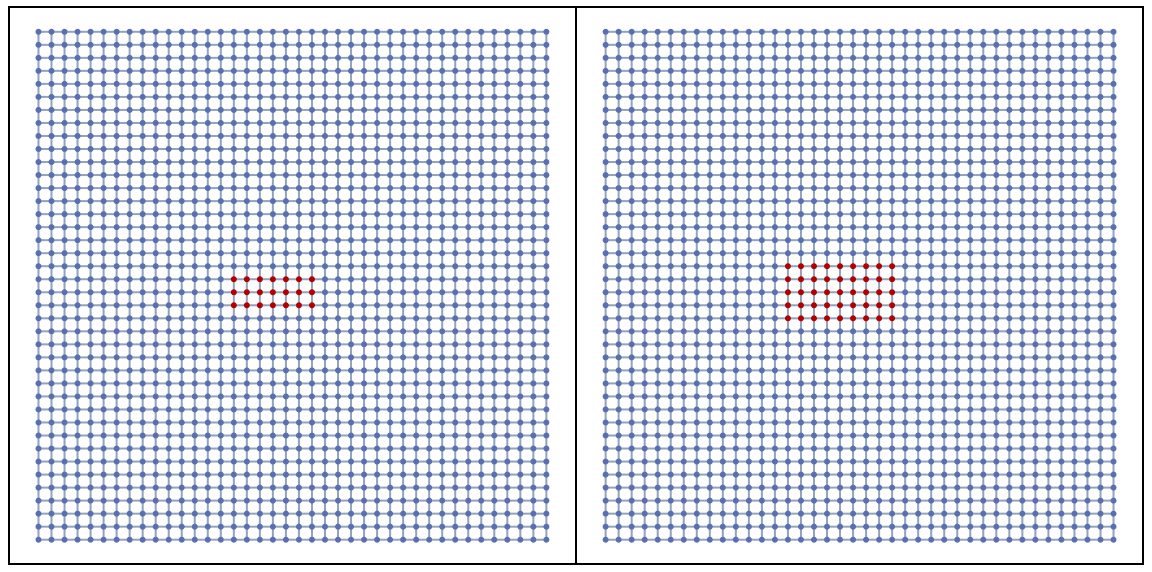
The volume of geodesics tube would then be the number of all the marked vertices. Now, 21 vertices are included in the tube. When radius is set to 3, 45 vertices are included in the tube. Therefore, the dimension projection estimation is ≈1.88 . Ideally, it is best to find all the geodesics when counting for the volume. In practice, it would become computationally expensive when tube length, , is greater than 5. Therefore, in the following discussion, only one geodesics is found for each pair of vertices in the initial and final balls, which yields very close results compared to the exhaustive method.
log(45)-log(21)
log(3)-log(2)
l
Result
Result
Grid Graph
Grid Graph
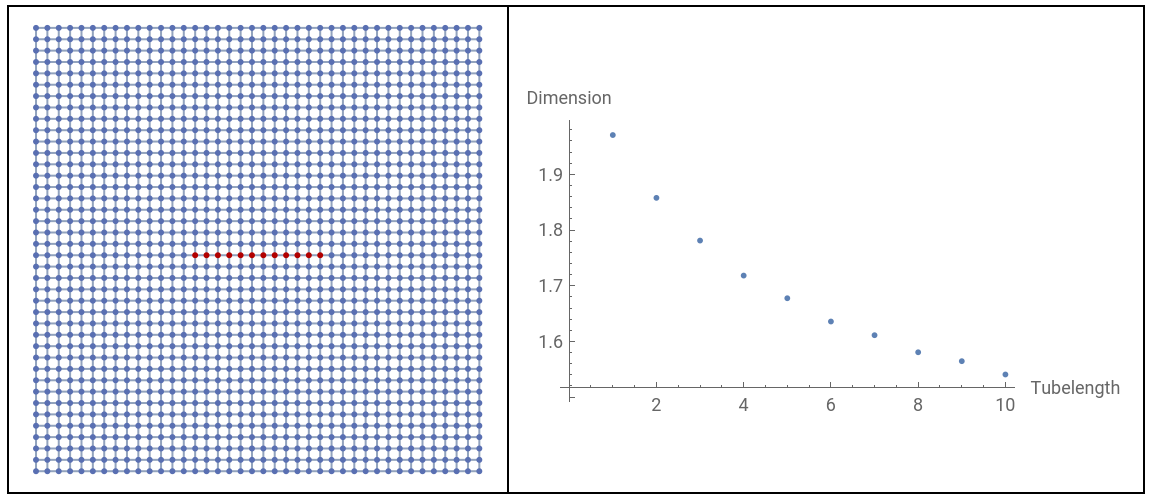
To begin with, the dimension on a line in the grid graph is calculated with increasing tube length. With the increase of tube length, the dimension projection does converge to around 1.52.
40*40 grid graph with vertex 580, 620, 660, 700, 740, 780, 820, 860, 900, 940, 980, 1020 highlighted and corresponding dimension list plot
Out[]=
Mean and uncertainty of all dimension projections from vertex 660 with max tube length four
MeanAround@Values@WolframDimensionEstimator[graph,660,"AllDimensionProjections",4]
Out[]=
1.931±0.023
The mean and uncertainty of dimension projection for every geodesic tube starting from vertex 660 within tube length four is also calculated. Because the mean value is reasonably close to the dimension of grid graph (2), the effectiveness of the algorithm is again verified. The small uncertainty () suggests that vertex 660 has a similar dimension projection in every direction, which implies a symmetric dimension tensor.
≈0.023
All dimension projections from vertex 580, 1020 with max tube length four
Wolfram Model 7714
Wolfram Model 7714
Model7714 (194 steps) with vertex 60, 62, 66 highlighted
Mean and uncertainty of all dimension projections from vertex 60, 62, 66 with max tube length three
Color plot of dimension projections’ uncertainty for each vertices in Model7714 (150 steps) with max tube length three, warmer color corresponds to larger uncertainty
Wolfram Model 71337
Wolfram Model 71337
Model71337 (500 steps) with vertex 30, 90, 177, 340, 660 highlighted
Mean and uncertainty of all dimension projections from vertex 30, 90, 177, 340, 660 with max tube length three
All dimension projections from vertex 340, 660 with max tube length three
Model71337 (500 steps) with vertex 337, 420, 345, 470 highlighted;
List of tube length between vertex pair (337, 420), (337, 345), (337, 499) ;
List of dimension projections between between vertex pair (337, 420), (337, 345), (337, 499) ;
Model71337 (500 steps) with vertex 530, 654, 662, 518, 646 highlighted;
List of tube length between vertex pair (530, 662), (530, 654), (654, 662), (518, 646) ;
List of dimension projections between between vertex pair (530, 662), (530, 654), (654, 662), (518, 646)
Wolfram Model 44568
Wolfram Model 44568
Model44568 (1000 steps) with vertices one edge from vertex 0 and 600 highlighted
Model44568 (1000 steps) with vertices 239, 643, 243, 582, 866, 382, 336, 796 highlighted
List of tube length between vertex pair (643, 239), (243, 582);
List of tube length between vertex pair (866, 382), (336, 796) ;
List of dimension projections between between vertex pair (643, 239), (243, 582);
List of dimension projections between between vertex pair (866, 382), (336, 796)
List of tube length between vertex pair (643, 239), (243, 582);
List of tube length between vertex pair (866, 382), (336, 796) ;
List of dimension projections between between vertex pair (643, 239), (243, 582);
List of dimension projections between between vertex pair (866, 382), (336, 796)
Dimension Tensor
Dimension Tensor
400-vertex-graph projected on 3-dimension ball
Conclusion and Future Direction
Conclusion and Future Direction
Keywords
Keywords
◼
Dimension
◼
Dimension Tensor
◼
Fractional Dimension
◼
Discrete Structure
Acknowledgment
Acknowledgment
Mentor: Nikolay Murzin
I’m incredibly grateful to Nik for giving important advice on my project and my code. He is always available to meet and talk with whenever I encounter difficultness during these two weeks. This notebook would not have been possible without his generous help.
I also wish to thank Jonathan for introducing this exciting topic and provides context for me to work on.
I must also thank Xerxes for providing fertile feedback on my project and allowing me to join this inspiring program.
I also wish to thank Jonathan for introducing this exciting topic and provides context for me to work on.
I must also thank Xerxes for providing fertile feedback on my project and allowing me to join this inspiring program.
References
References
◼
[1] Jonathan Gorard, Algorithmic Causal Sets and the Wolfram Model
◼
[2] Jonathan Gorard, WolframRicciCurvatureScalar.nb
◼
[3] Jonathan Gorard, WolframRicciCurvatureTensor.nb
◼
[4] Quinn McIntyre, [WSC20] Explorations of the Hypergraph wm44586
◼
[5] Leo Rodriguez, Shanshan Rodriguez, On the Principle of Holographic Scaling
◼
[6] Mike Guidry, Modern General Relativity