CITE THIS NOTEBOOK: Graph visualization for synthesis by Alec Graves. Wolfram Community FEB 13 2023.
Notes on the Synthesis of Form by Christopher Alexander is a fascinating reflection on the synthesis of systems (‘form’) which solve complex problems in high dimensions. Alexander was focused on the realm of physical design when he recorded his mathematical treatment of the design process, but the generality of the procedure which he details is potentially applicable to many types of design from physical to mental.
Notes on the Synthesis of Form
Notes on the Synthesis of Form
The essential premise of Alexander’s work is that there are clear distinctions between the ‘unselfconscious’ design process and the ‘selfconscious’ design process which make the former more likely to succeed than the latter. First among these differences is the local and direct feedback the agent of unselfconscious design receives about the form from the environment during its construction and operation. There is no mental picture or simulator in which a designer develops and molds the form before it is finally constructed and forced into operation in the real world. Additionally, the template for the unselfconsciously produced form is passed down as a linear sequence of steps through ritual and tradition and is generally flexible enough that local adaptation can be performed without such adaptation being preconceived. Finally, the lack of a complete ‘mental model’ of the design which needs to be stored in the head and thought of and manipulated and explored holistically makes the unselfconsciously designed form much more likely to be free of defects.
In contrast, the selfconscious design process is abstracted from the real world, lifted into the domain of the mind or even higher to a symbolic representation. The mind is a fickle, weak construction that craves linear progressions and is unable to view the whole as a whole all of the time, creating a need for abstractions and breakdown of the high-dimensional requirement space into a hierarchy. Unfortunately, the abstractions chosen in design are too often shaped by culture and language rather than the specifics of the problem domain.
The generalized goal of design can be conceived of as the synthesis of form which solves a problem in some context. Given that we want to consciously and intentionally make new forms without preconceived notions or continuous real-world experimentation, we need to be able to reason about the context and form in a model separate from the real world. Given the limitations of our animalistic mind, it is useful to build symbolic representations of context and form which can be interrogated and refined over time. Furthermore, to help construct this symbolic representation, it is useful to break down the problem into a hierarchy of requirements that optimally coincides with the natural shape of the form in context. Alexander refers to this breakdown as the ‘program’ to be realized during the synthetic process. An appropriate program provides new insights into the shape the form must take and turns synthesis into a reasonable task.
Realization of Alexander’s Method in Wolfram Language
Realization of Alexander’s Method in Wolfram Language
Notes on the Synthesis of Form describes a computational procedure which can assist in creating such a natural and useful hierarchal breakdown of a problem. To create an appropriate breakdown, the problem is encoded as a set of requirements that the final form must have in order to not be a misfit in its context. The procedure makes three assumptions about the requirements that make up the problem definition:
1
.The requirements must be of equal scope.
2
.The requirements must be as independent of one another as reasonably possible.
3
.The requirements selected must be as small in scope as possible and hence as specific and detailed and numerous as possible.
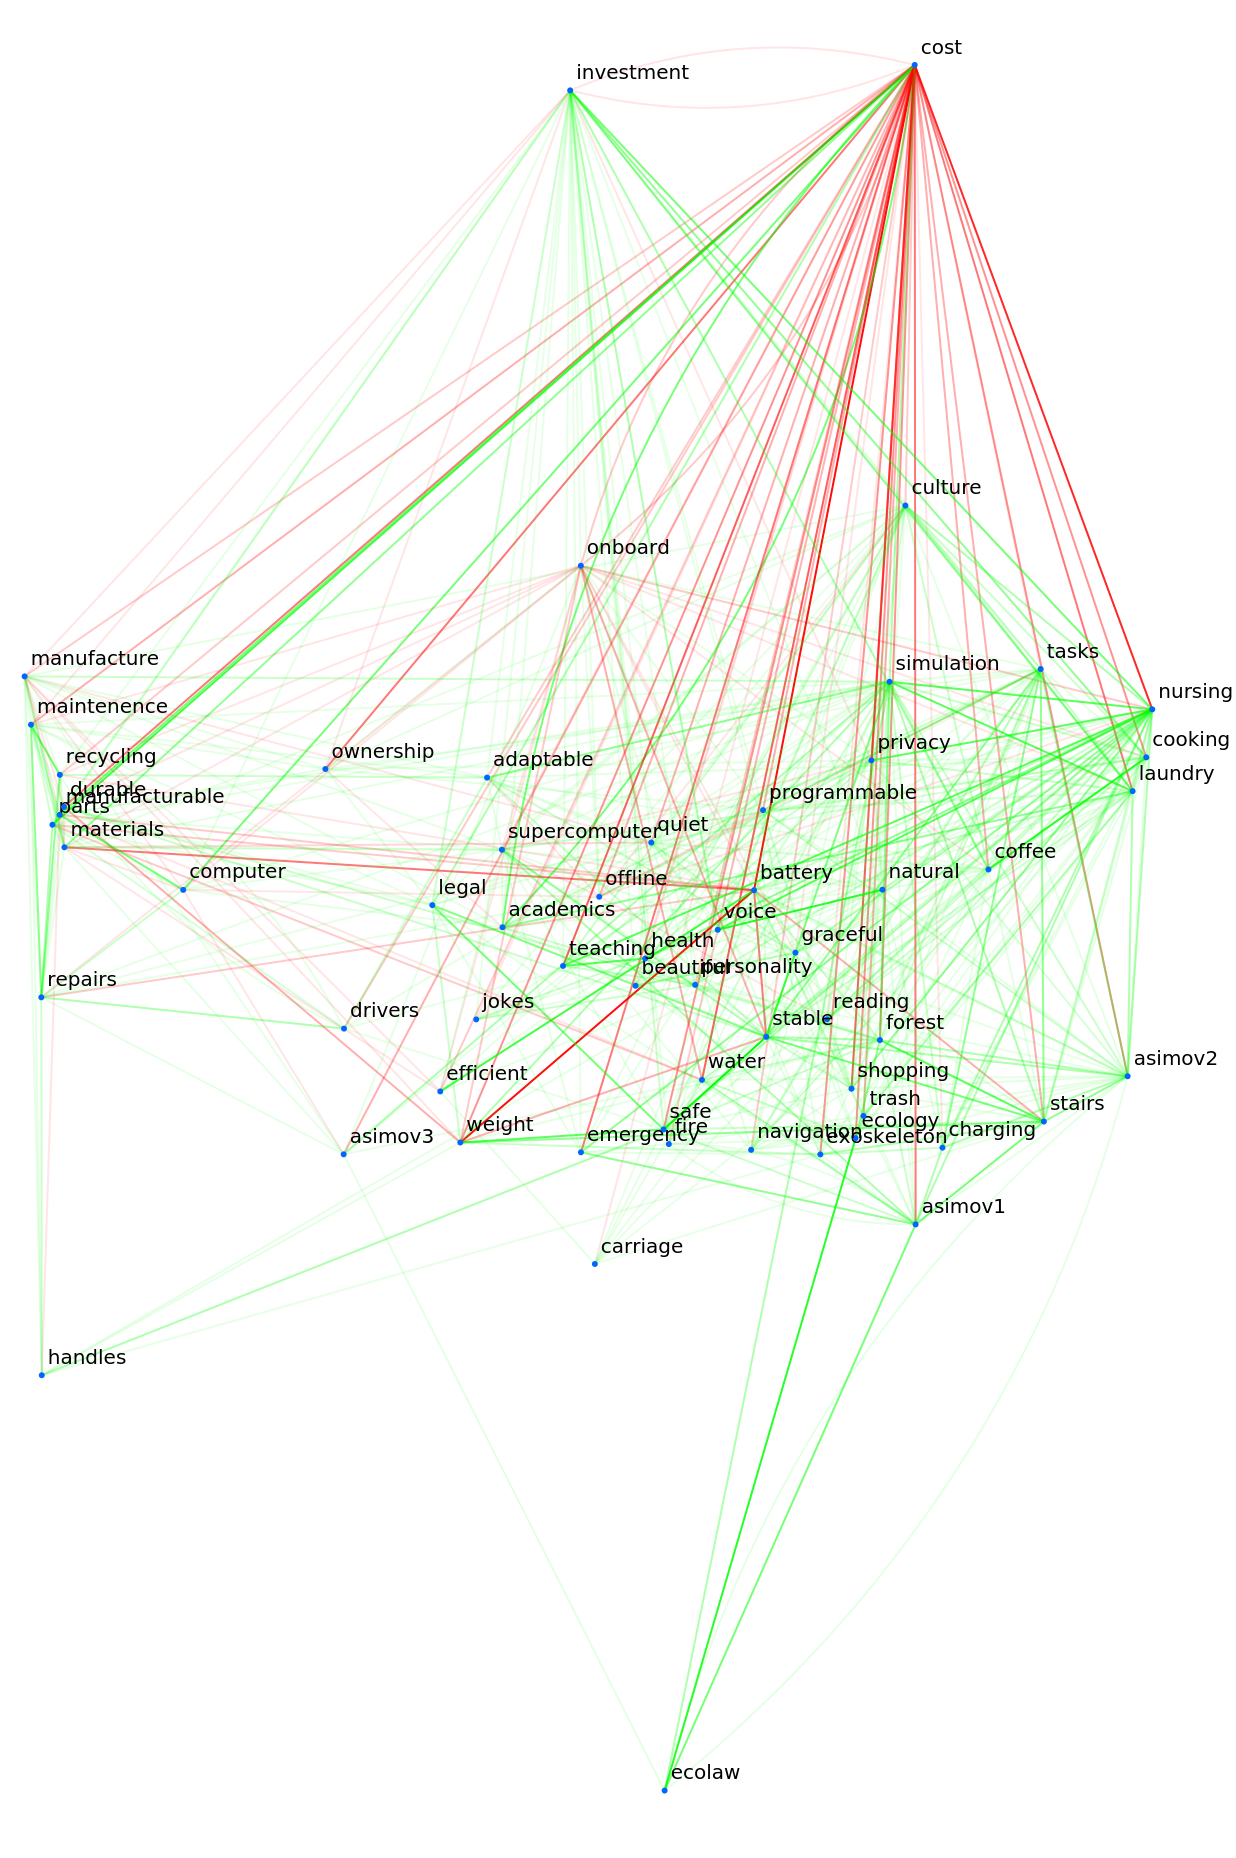
In Alexander’s process, this set of requirements is transformed into a graph by creating edges between requirements based on coincidence probabilities. If two requirements are likely to occur together in a random form generated to solve our problem, the edge between them would be given a positive weight. If two requirements are unlikely to occur together, a negative probability is assigned. Using this connection information, our graph can be algorithmically decomposed into a hierarchy of modules that naturally group related things and separate unrelated things.
As an example, let us think of the design of a robotic household assistant.
Requirements are a property of the ensemble (context and form) which can unambiguously classify a dimension of a form as either misfit or fit. Each requirement is represented by a misfit variable which can be either 1 (for misfit) or 0 (for a fit).
For some requirements, a standard may exist that allows us to easily determine whether a given form is a misfit (e.g. ‘I know the cost must be ≤ $7,000’). However, many requirements will not be based on such understood or even quantifiable properties, especially in the case of novelty. The important part is that a requirement in our set allows boolean distinction into misfit or not.
“any state of affairs of the ensemble which derives from the interaction between form and context, and causes stress in the ensemble, is a misfit”
In[]:=
requirements=;
In[]:=
requirements[[;;5]]
Out[]=
costthe cost must be reasonable (under $10,000),stablethe robot must not fall down,batterythe robot must be able to move around for an acceptable duration on a single battery charge (60 minutes operating),waterthe robot must be reasonably waterproof (120 minutes submerged in saltwater),weightthe robot must be light enough to carry when its battery runs out (45 lbs)
Now we have the requirements specified, we can specify interaction between our misfit variables through assigning edge weights. We will do this by specifying a positive edge weight if there is concurrence between variables (variables are likely to be the same 1/1 or 0/0 given a random form) and a negative weight if there is conflict (variables are likely to be opposite 1/0 or 0/1 for a random form). It is assumed by default that there is no connection between misfit variables.
These edge weights are assumed to be symmetric and bidirectional (our adjacency matrix is symmetric). If I accidentally specify a connection twice, the edge weights should be averaged.
“We shall say that two variables interact if and only if the designer can find some reason (or conceptual model) which makes sense to him and tells him why they should do so”
In[]:=
connections=;
In[]:=
connections[[;;2]]
Out[]=
{cost{battery,-90,water,-60,weight,-40,privacy,-50,recycling,-20,quiet,-30,parts,70,materials,40,ownership,-50,onboard,-20,academics,-10,manufacture,-20,investment,-30,beautiful,-10,charging,-5,stairs,-30,forest,-40,cooking,-40,coffee,-30,laundry,-50,nursing,-80,health,-5,teaching,-60,asimov1,-50,asimov2,-40,asimov3,-30,tasks,-5,maintenence,-30,adaptable,-20,drivers,-20,durable,-50,exoskeleton,-40,voice,-10,programmable,-30,ecology,-40,trash,-30,emergency,-50,academics,50,legal,30,safe,-40,jokes,-5,graceful,-10,fire,-20,manufacturable,50,computer,50,onboard,-20,offline,-30,carriage,-10,reading,-5,shopping,-60,navigation,-20,efficient,-20,culture,-20,personality,-20,investment,-10,simulation,30,supercomputer,-10,natural},stable{battery,-50,weight,-30,stairs,50,forest,30,laundry,10,nursing,20,asimov2,30,tasks,40,exoskeleton,10,programmable,10,legal,40,safe,95,graceful,60,onboard,-30,shopping,20,academics,5,durable,20,simulation,40,supercomputer,30,adaptable,20}}
Make sure our connections have the same name as our keys.
In[]:=
Sort[((connections/.Rule[x_,y_]:>{x,y}//Flatten//DeleteDuplicates)/.x_Integer->Nothing)]==Sort[Keys[requirements]]
Out[]=
True
Now, let’s convert our connections to the Wolfram graph format.
In[]:=
rulify[connections_Association]:=rulify[Normal[connections]];rulify[connections_List]:=(connections/.Rule[x_,y_List]:>({x#[[1]],Clip[N[#[[2]]]/100,{-1,1}]}&)/@Partition[y,2])//Flatten[#,1]&//Transpose;rulify[<|1->{1,2,3,4,5,6},2->{2,4,5,6}|>]
Out[]=
{{11,13,15,22,25},{0.02,0.04,0.06,0.04,0.06}}
In[]:=
{edges,weights}=rulify[connections]
Let’s create a function to automatically color our graph based on the connection weight too.
In[]:=
getStyles[edges_,weights_]:=With[{e=#[[1]],w=#[[2]]},e->{If[w<0,Red,Green],Opacity[Clip[N[Abs[w]]/Max[Abs[weights]],{0.1,1.0}]]}]&/@Transpose[{edges,weights}]e={12,23};w={-50,20}/100/2getStyles[e,w]Graph[e,EdgeWeight->w,VertexLabels->Automatic,EdgeStyle->getStyles[e,w]]
Out[]=
-,
1
4
1
10
Out[]=
{12{,Opacity[1.]},23{,Opacity[0.4]}}

Out[]=

g=Graph[edges,EdgeWeight->Sqrt[Normalize[weights]^2],VertexLabels->Automatic,EdgeStyle->getStyles[edges,weights],PlotTheme->"LargeGraph",GraphLayout{"HighDimensionalEmbedding"}]
Out[]=
In[]:=
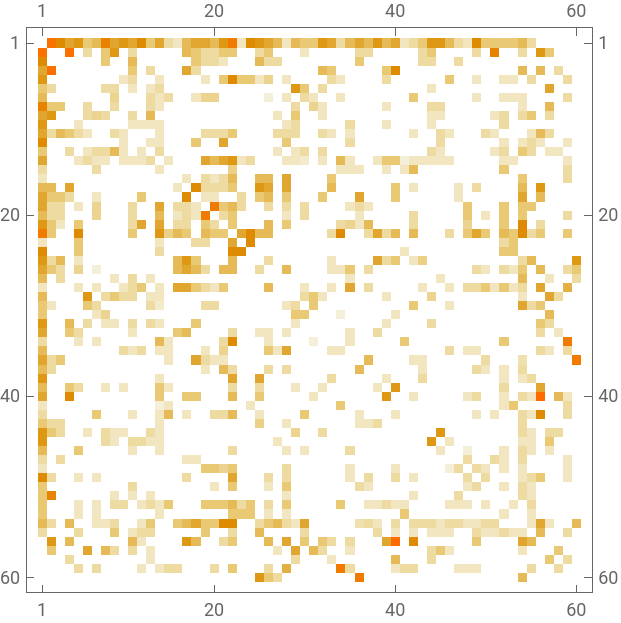
WeightedAdjacencyMatrix[g]//MatrixPlot
Out[]=
We can also make a 3D visualization of our graph:
In[]:=
g3d=GraphPlot3D[edges,EdgeWeight->Sqrt[Normalize[weights]^2],VertexLabels->Automatic,EdgeStyle->getStyles[edges,weights],GraphLayout->"HighDimensionalEmbedding",PlotTheme->"LargeGraph",ViewAngle->Pi/8,RotationAction->"Clip"]
Out[]=

Now, we can use FindGraphCommunities to cluster our graph into connected communities.
Let’s try to break down these communities further.
Now, we want to be able to group this breakdown hierarchically. Can CommunityGraphPlot handle this?
Kinda, but the layout is not very perfect. We can try to break it up instead:
Nice.
Conclusions
Conclusions
There are many other interesting things one could possibly do with this visualization and design methodology. I am especially curious what this approach would be able to do for the design of complex software systems like those used to control robotic systems. The concept that ‘things that work together should be grouped together’ is widely recognized among leaders in DevOps and microservice system deployment, and this methodology is able to use computational methods for decomposing a problem with hundreds or thousands of nodes. It would be interesting to pull in some real-world networked software system data and see what the output of this kind of analysis would look like. If I ever build a complex software ecosystem from scratch, it will definitely have the ability to generate these kinds of visualizations automatically.
This strategy is very nice for recording and manipulating the complex interactions between requirements, but data entry for this system could be made much easier and more streamlined with proper autocomplete and some slight changes. It might be easier to first lay out connections then afterwards go through and determine strengths. Additionally, positive and negative connections are treated equally, so the sign of the input is unnecessary. Similarly, it is probably unnecessary to have anything more than a strong/weak connection indicator, or perhaps three strengths of connection. Lastly, I think it could be fun to play with ML name suggestions for the different graph communities that are automatically found.
I am happy to see all of the cool stuff that is already built into the Graph construction, processing, and visualization systems of WL. I am also excited for continued work on graph community algorithms and visualization.