Abstract
Abstract
In this project, I analyzed people's sentiment of COVID-19 vaccines over time on the social media platform, Reddit. Using the Reddit Pushshift API, I extracted thousands of comments and posts from time periods throughout the past year on Reddit, and used natural language processing to classify their sentiment. In trying to make sense of the data, I plotted it on a stacked date list plot and labeled past major events that might have affected people's sentiment of vaccines.
Introduction
Introduction
Ever since their introduction, COVID-19 vaccines have been one of the hottest topics of debate in the world. Many say they are what will save us from this pandemic. Others say that they will destroy your DNA. But exactly how many people support vaccines? How many are against them? Did the perception of vaccines change over time?
To answer these questions, I went to Reddit, the popular social media platform where unlike Facebook and Twitter, everyone is anonymous and has more freedom to express their true opinions. Using the Reddit Pushshift API, I got comments and posts from select time periods throughout the past year, and used natural language processing to classify their sentiment. Seeing how people perceived the general term “vaccines” would be quite ambiguous, however. I needed to see how people perceived the most influential vaccines individually. In particular, I analyzed the changing perception of COVID-19 vaccines from Pfizer BioNTech, Moderna NIAID, Johnson & Johnson, Sinovac, Sinopharm, and AstraZeneca. Out of curiosity, I also analyzed the perception of mRNA and anti-vaxxers. The data is quite interesting, and extremely unexpected.
Getting the Data
Getting the Data
The first step to classifying sentiment of Reddit posts is actually getting the data from the posts. To do this, I used the Reddit Pushshift API, which lets me get comments filtered by keyword, subreddit, time intervals, and quantity of posts. You can get tons of information about each comment, but all we care about is the body text.
Get body text for 5 Reddit comments in the last 7 days with the keyword "vaccine" and import as a RawJSON dataset:
RedditData = Dataset[URLExecute["https://api.pushshift.io/reddit/search/comment/?q=vaccine&size=5&fields=body&after=7d&before=0d","RawJSON"]["data"]]
Out[]=
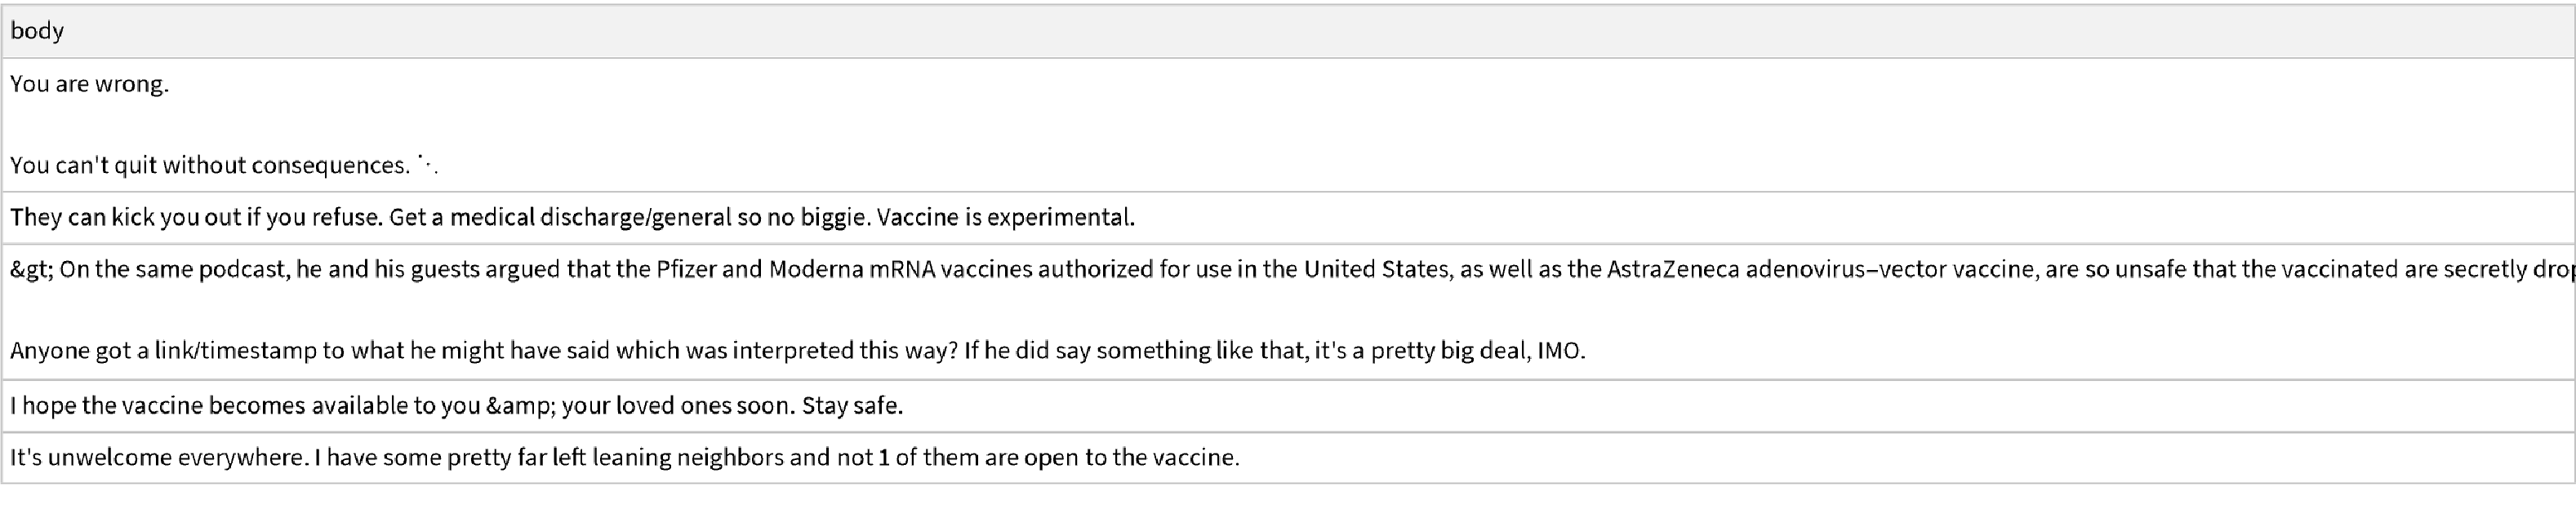
We get some fairly interesting posts. By reading them, we can interpret the sentiment of each comment ourselves, but we can also use natural language processing to automatically classify the data as positive, neutral, or negative.
Classify the sentiment of the data with the Wolfram Language's built-in Classify function:
In[]:=
Classify["Sentiment",RedditData[All,"body"]]
Out[]=

Now we have some interesting sentiment data. However, it would take forever to get comments and classify their sentiment this way, and we need to change keyword, dates, size, along with many other fields depending on what we're looking for. The best way to do this is with a flexible function.
Function that constructs a table of Pushshift URLs with varying parameters, gets reddit comments from each individually, and stores their classification in a single list:
In[]:=
GetSentiment[start_,end_,keyword_]:= (Module[{urls,data},urls = Table[StringJoin["https://api.pushshift.io/reddit/search/comment/?q=",keyword,"&fields=body&size=100&after=",ToString[date+7],"d&before=",ToString[date],"d"],{date,start,end,7}];data = Dataset[URLExecute[#,"RawJSON"]["data"]]&/@urls; Flatten[Classify["Sentiment",data[[#]][All,"body"]]&/@Range[Length[data]]]])
Sort data into time clusters and get more organized samples:
In[]:=
GetSentimentData[start_,end_,keyword_] := Flatten[GetSentiment[#,#+14,keyword]&/@Range[start,end,14]];
Johnson&Johnson and AstraZeneca have a separate function that just filter searches to the most active COVID-19 subreddit so the data is only about vaccines:
GetSubredditSentimentData[start_,end_,keyword_]:=(Module[{jsonurls,datasub},jsonurls=Table[StringJoin["https://api.pushshift.io/reddit/search/comment/?q=",keyword,"&subreddit=Coronavirus&fields=body&size=100&after=",ToString[date+7],"d&before=",ToString[date],"d"],{date,start,end,7}];datasub=Dataset[Import[#,"RawJSON"]["data"]]&/@jsonurls;Return[Flatten[Classify["Sentiment",datasub[[#]][All,"body"]]&/@Range[Length[datasub]]]]])GetSubredditSentimentData[start_,end_,keyword_]:=Flatten[GetSubredditSentimentData[#+14,#+28,keyword]&/@Range[start,end,14]];
Just like that, we can get sentiment data about any topic at any time. Because it takes a long time to load, I preloaded the data into this notebook. The keyword I used for each topic was "vaccine", "pfizer", "moderna", "j&j", "sinonvac", "sinopharm", "AZ", "mRNA", and "antivax". These keywords were determined from the most common way to reference each of the vaccines/topics on Reddit. Because there was insufficient data for Sinovac and Sinopharm, their data dates back 100 days, while the rest of the keywords data goes back a year.
Getting the Proportion of Positive, Neutral, and Negative Sentiment
Getting the Proportion of Positive, Neutral, and Negative Sentiment
We have all this data, but it is very hard to read as a messy list of sentiments. It would be much easier if we could get the ratio of positive to neutral to negative sentiment for each time cluster. Fortunately the Wolfram Language's Counts function, which stores unique elements into an association, lets us do that.
Get the ratio of positive and neutral sentiment for any time cluster of data:
In[]:=
PositiveRatio[pos_]:= (N[Total[Counts[pos]["Positive"]]/Total[Counts[pos]]]100)NeutralRatio[neu_]:= (N[Total[Counts[neu]["Neutral"]]/Total[Counts[neu]]]100)
We don't need to calculate the NegativeRatio because these numbers are percentages, and the negative ratio will just be 100 minus the positive and neutral ratios. Now that we have defined those functions, let's map them across the data.
Store positive and neutral ratios of data as a list, mapping each function over the vaccine data. This is done for the rest of the data as well:
In[]:=
VaccinePositive = PositiveRatio[#]&/@VaccineDataVaccineNeutral = NeutralRatio[#]&/@VaccineData
Out[]=
{13.8333,15.,16.3333,14.6667,13.,15.3333,14.5,12.6667,13.,12.8333,12.6667,12.8333,16.1667,17.5,14.5,12.6667,12.3333,11.6667,14.,15.6667,12.6667,12.,13.5,12.5,12.5,13.8333,14.6667}
Out[]=
{32.6667,30.5,31.,34.5,35.8333,34.6667,37.1667,39.3333,38.5,38.,39.5,38.,35.,32.8333,31.8333,34.3333,36.1667,36.1667,35.3333,34.8333,33.5,31.5,33.3333,33.6667,32.3333,32.1667,32.6667}
Visualizing the Data as a StackedDateListPlot
Visualizing the Data as a StackedDateListPlot
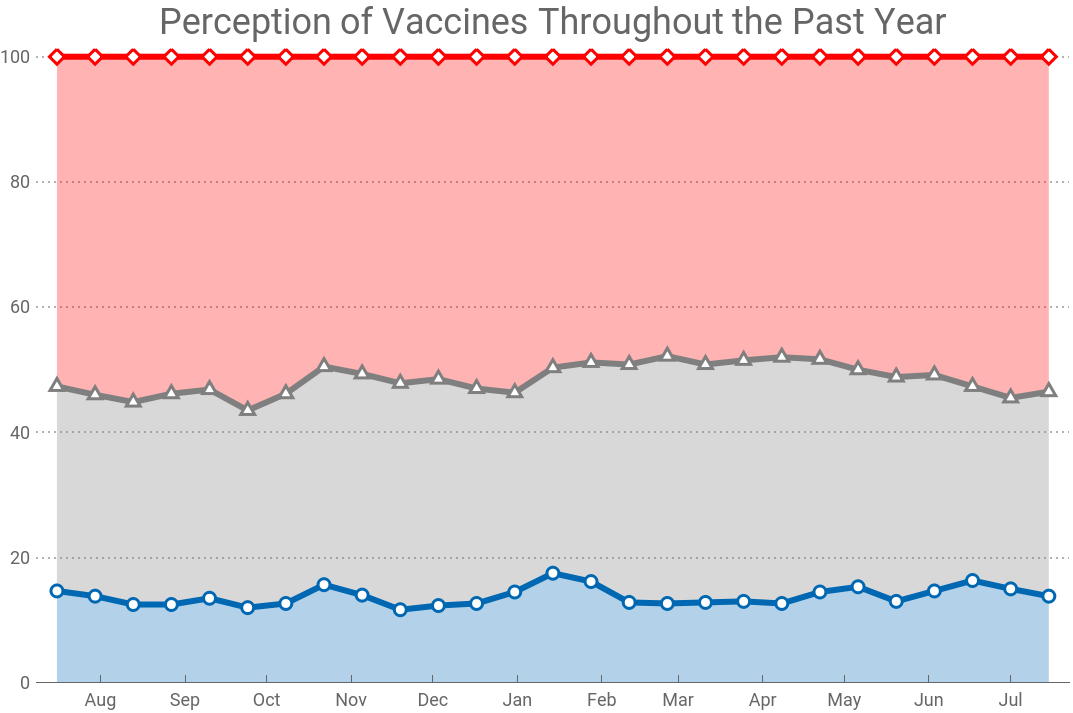
With the sentiment ratios mapped, we could now graph it right now on a list plot, but that would lead to several problems. Firstly, we are graphing over time, and the x axis labels for a list plot tell us nothing about when sentiment had a specific value. Furthermore, since the positive, neutral, and negative sentiments all add up too 100, it would make much more sense to use a stacked list plot. We can solve both of these issues by visualizing our data with the StackedDateListPlot function.
The StackedDateListPlot function needs more input information than the ListPlot function because each point of information requires a date. It would be arduous to hand code each individual date for each individual graph, so we can generalize a function that creates a list of dates with varying start dates, end dates, and time between each date. Once we have that list, we can thread them with their respective time clusters in the data.
Get a set of dates and thread them to corresponding data:
DateThread[start_,end_,interval_,data_] := (Thread[{Table[DatePlus[Today,-n],{n,end,start,-interval}],data}]);
Now that we can thread sentiment ratios with time, we can create a StackedDateListPlot with lines showing the positive, neutral, and negative sentiment ratios for a given keyword over time. Note that all ratios have the same start, end, and time intervals.
Put everything we have together on a StackedDateListPlot:
StackDatePlot[start_,end_,interval_,neg_,neu_,pos_,title_]:= StackedDateListPlot{DateThread[end,start,-interval,neg],DateThread[end,start,-interval,neu],DateThread[end,start,-interval,pos]},
We can apply this function to get plots for all of our data.
Creating a stacked date list plot for the vaccine data, graphed as percentages out of 100 over time. Plots are made for the rest of the data as well:
In[]:=
VaccinePlot = StackDatePlot[0,377,14,VaccinePositive,VaccineNeutral,100-VaccinePositive-VaccineNeutral,"Perception of Vaccines Throughout the Past Year"]
Out[]=


Labeling Key Points
Labeling Key Points
We have some pretty some interesting data. However, current events play a key role in the sentiment of vaccines and other key words, so it would be nice to visualize those data points.
Create a text label at any point on the Cartesian plane:
PointLabel[x_,y_,text_]:=(Labeled[{x,y},Style[text,Bold]])
Create a plot for any number of points and text labels:
LP[list_,grids_]:=ListPlotlist,
Using the List plot function, we can now label all the key points. We now need to plug in dates and text for all of our plots.
Implement LP to get major events for the vaccine plot. These events' coordinates were calculated in respect to the current day, and how they look formatted with other points:
In[]:=
VaccineLP=LP[{PointLabel[37,16,"Russia Approves First Vaccine"],PointLabel[163,32,"First Vaccines Approved in US"],PointLabel[338,16,"50% US Adults Vaccinated"],PointLabel[382,29,"900M Globally Vaccinated"]},{37,163,338,382}]
Out[]=
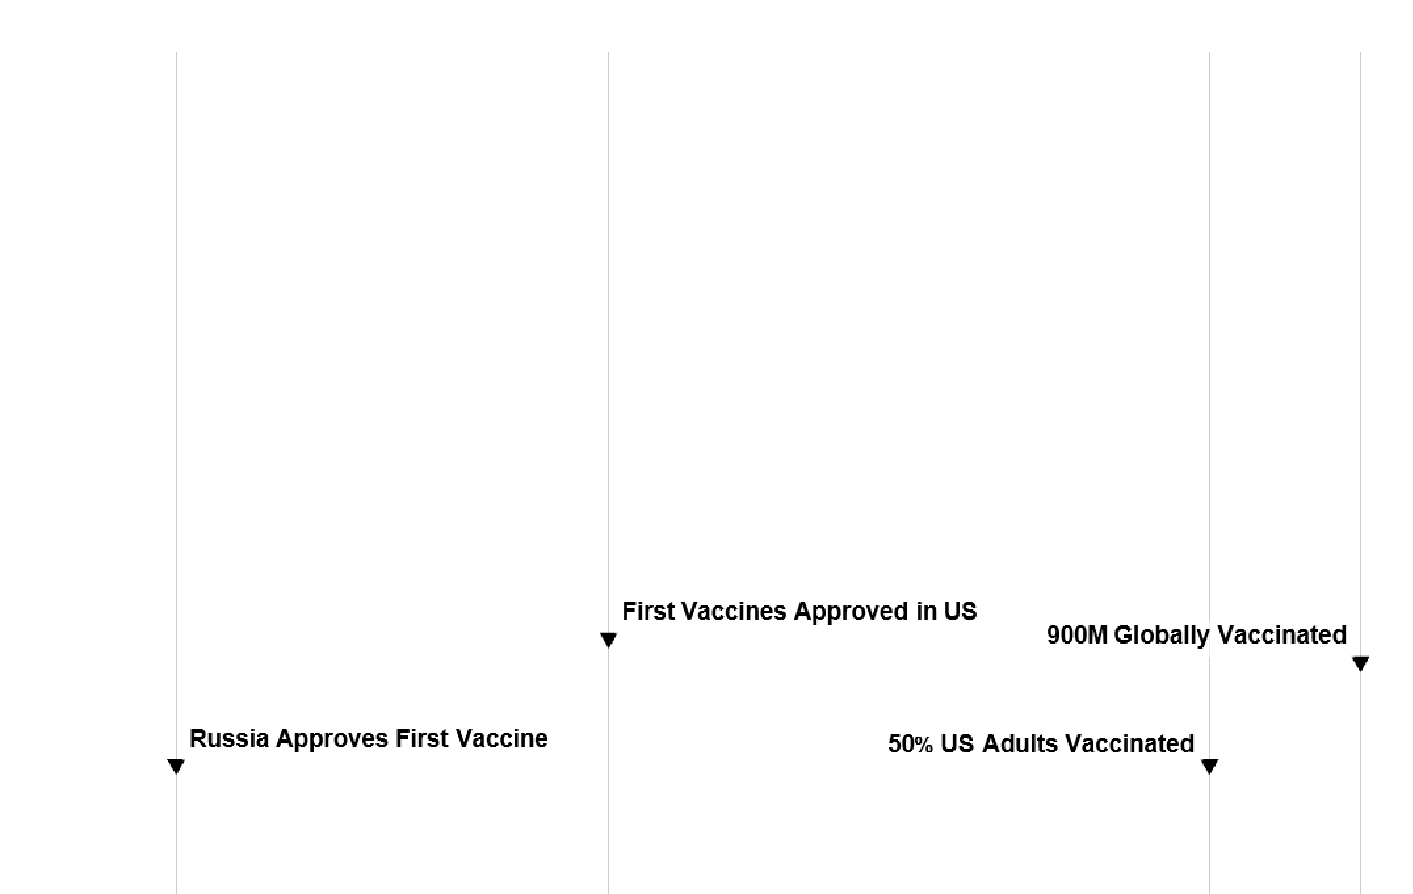
All that's left is implementing these points onto our original plots.
Overlay the points with our stacked plot:
The Results
The Results
With all of our code and visualizations finished, we can now see the results. All graphs are plotted as percentages out of 100 over time. Emergency Use Authorization(EUA) dates are for the United States in all plots unless otherwise specified.
Perception of Vaccine Throughout the Past Year:
The data reveals very interesting result. At times, there is more than 50% negative sentiment. Positive sentiment never even goes above 20%. There are variety of possible reasons why:
◼
While discussion is negative, a majority users are not commenting and posting; so this data cannot comment on the larger opinions of the Reddit user base. People are naturally more inclined to post about something they have dissent for than something they like, and as a result, comments are skewered towards negative sentiment. This is one of the downfalls of sentiment analysis on social media, which ultimately stems from biased data.
◼
Perception of COVID-19 vaccines is not black and white. There are different types of perceptions, all of which people express on the internet. The most basic example would be if one supports getting a vaccine or not. This is likely what was the data was expected to portray, however that is not the case. People also complain about the lack of vaccine distribution, vaccine manufacturers' corruption, anti-vaxxers spreading rumors, etc. There are people with negative sentiment about vaccine distribution but still likely support vaccines, however with current NLP technology, there is no way to correlate different nuanced opinions in sentiment alone. With that idea in mind, interpret this data as overall sentiment of the COVID-19 vaccine discussion on Reddit.com
◼
Sarcasm: Although easy for us to detect, it is astronomically difficult for current NLP technology to detect sarcasm. Of the three reasons outlined, sarcasm affects the data the least, but it is important to keep in mind.
The variety of sentiment data is narrowed when talking about each major vaccine manufacturer. If someone is strictly against vaccines, it's highly doubtful they will mention a specific vaccine company like Sinovac in their comments. Comments about specific vaccines talk more about the vaccine itself, which is optimal for this project.
Perception of the Pfizer Vaccine Throughout the Past Year:
In the plot for the Pfizer Vaccine, the sentiments stay overall consistent until early March, when there is a spike in positive sentiment and decrease in negative sentiment. The label "Confirmed 98.8% Effective" helps us better see a possible correlation for the surge of positive sentiment. It also seems that a few weeks after a EUA was issued for adolescents, the big chunk of the users on Reddit, sentiment became more positive once again.
Perception of the Moderna Vaccine Throughout the Past Year:
The Moderna plot has far more interesting results than the Pfizer plot. It is very clear positive sentiment for Moderna decreased over time, even becoming over 40% negative in sentiment in early June. Sentiment for the Moderna vaccine is far more polarized than other vaccines.
Perception of the Johnson&Johnson Vaccine Throughout the Past Year:
The Johnson&Johnson plot follows a trend similar to the Moderna plot, but features a massive increase in negative sentiment sometime in October 2020. The most likely caused by the news of vaccine trials being paused due to an unknown illness developed in one of the trial patients. It also seems that as Pfizer and Moderna received EUA's in Mid December, Johnson&Johnson sentiment mysteriously began decreasing. Negative sentiment continued to increase throughout 2021, but with the Johnson&Johnson vaccine's messy history, positive sentiment stayed mostly consistent.
Perception of the Sinovac vaccine Throughout the Past Year:
With Reddit being primarily used by people in the United States, there wasn't much talk about Sinovac until the last 100 days. Nothing particularly fascinating happens with the perception of the Sinovac Vaccine like it did Moderna and Johnson&Johnson. Negative sentiment is gradually increasing as more news talks about Sinovac side effects, and positive sentiment consistently stays below 20%.
Perception of the Sinopharm Vaccine Throughout the Past 100 Days:
Similar to the Sinovac plot, nothing super interesting happens with the perception of the Sinopharm Vaccine over time. It is intriguing however that sentiment didn't move almost at all when Sinopharm effectiveness was questioned in early June.
Perception of the AstraZeneca Vaccine Throughout the Past Year:
The AstraZeneca plot is quite rocky. Like all the other vaccines, overall sentiment decreases in late 2020, but AstraZeneca actually continues to decrease in sentiment in early 2021. For the timeframe, this drop is more significant than in any other plot, and a good explanation for this is because of AstraZeneca's high vaccine prices, which reduced its availability in poorer countries. This was quite popular news, and people weren't too happy about it.
So there we have it. The perception of all the COVID-19 Vaccines over time. Let's take a look at some vaccine-relevant terms now.
So there we have it. The perception of all the COVID-19 Vaccines over time. Let's take a look at some vaccine-relevant terms now.
Perception of mRNA Throughout the Past Year:
Depending on how one feels about mRNA, this data might come as a surprise or completely expected. mRNA sentiment has been almost always decreasing in the past year, with positive sentiment reaching an all-time low, and negative sentiment reaching an all-time high. It all started in November when news about Pfizer and Moderna using mRNA came out, which caught Reddit's attention. It's quite clear they weren't too fond of it. Even now, there is still a ton of paranoia around mRNA, such as news confirming mRNA vaccines can cause heart disease. Only time will tell if mRNA sentiment improves.
Perception of Antivaxxers Throughout the Past Year:
Just to see how much of Reddit isn't supportive of vaccines, I got sentiment data about the perception of anti-vaxxers. As expected, there is majority negative sentiment, however there is also a decent amount of positive sentiment. What's more interesting is that the perceptions haven't changed much from a year ago. Anti-vaxxers are firm in their opinions, and dissent for them remains ever as large.
Conclusion
Conclusion
With COVID-19 still playing a major part in our lives, it is quite fascinating to see how the general public perceived the COVID-19 vaccines . Even more so, the data uncovered some unexpected, and perhaps ugly truths about sentiment for vaccines . But there's a lesson that can be learned from this project, a fairly basic, but true lesson: we are cautious. Vaccines have been around for a long time, however with all the news about vaccines altering our DNA, infecting us with disease, and causing blood clots, it makes sense we would be wary of it. It's almost certain that at least one time in the past year, we have been cautious of COVID-19 vaccines, or the vaccine manufacturers. Where do we go to express our concerns? Social media. That's just how we are.
Extensions:
Extensions:
There are many extensions possible for this project. I could compare sentiment about vaccines in correlation to social media platforms. It would be quite interesting to compare vaccine sentiment across different groups and demographics. Another extension would be to not just analyze sentiment for vaccines, but anything COVID-19 related. Changing Sentiment for masks, social distancing, and quarantine are a few examples of possible topics.
Acknowledgments
Acknowledgments
Huge thanks to Zach Shelton for being an amazing mentor and making this project so great! I would also like to thank my mentor group and the rest of the students, mentors, and staff for a wonderful experience at Wolfram Summer Camp.
Keywords
Keywords
◼
Vaccines
◼
Sentiment Analysis
◼
Natural Language Processing
◼
Timelines