Food security and sustainability is a global issue that greatly affects the population on a social and economic scale. For regions that lack the suitable land, climate, or other factors for traditional farming methods, hydroponic farming is theoretically a great alternative. The process of hydroponic farming takes place fully indoors, using up to 90% less water than traditional agriculture and does not rely on pesticides. The implementation of these farms can reduce the need for imported crops and guarantee fresh produce globally. However, the initial investment of these farms is very expensive. In my project, I analyze which regions in the world should invest in hydroponics based on its climate as well as which crops it produces, if any.
Investigating Production Densities of Countries Globally
Investigating Production Densities of Countries Globally
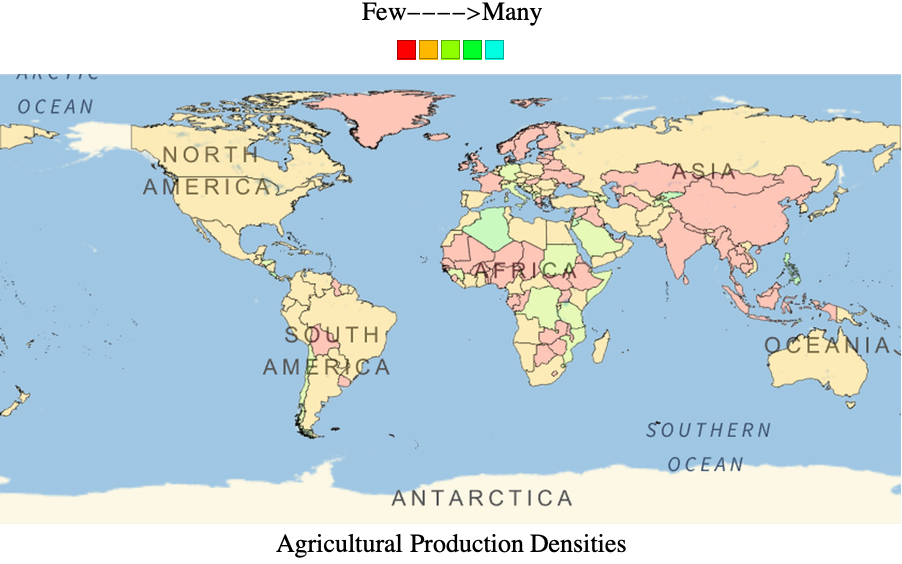
To explore which countries do the most crop farming, I generated a map that highlights each country based on its total crop production. Countries that are not major crop producers rely on imports as their primary source of produce, thus indicating opportunities for hydroponic farms.
First, I defined a variable that lists all the countries.
CountryData[] is a built-in symbol in the Wolfram Language that lists every country, so I redefined it as a string to make it easier to incorporate into other lines of code:
In[]:=
countries=CountryData[];
Then, I defined a variable that lists the agricultural products produced in every country. Due to the limited data available in entity data, there are inaccuracies in my project regarding where certain crops are grown.
I used an association thread to make an association of a country and it's agricultural products from entity data:
In[]:=
agriculturalData=AssociationThread[countries,EntityValue[countries,EntityProperty["Country","AgriculturalProducts"]]];
This variable lists all the agricultural products relevant to my project.
I only needed some of the agricultural products from entity data, so I defined a list of them as string "agProducts":
In[]:=
agProducts=;
Then I removed any values of agriculturalData that are not in agProducts from a country.
I used the Intersection function to list the elements in agriculturalData that are common to elements in agProducts. Then, I used the map function to replace "Missing["NotAvailable"]" with an empty list:
In[]:=
includedFoods[num_Integer]:=Intersection[(Values[agriculturalData]/.Missing["NotAvailable"]->{})[[num]],agProducts];
This variable stores the agricultural products of every country, except it only includes the values listed in agProducts.
I applied an association to the list of relevant agricultural products:
In[]:=
filteredAgriculturalData=Association@@Table[Keys[agriculturalData][[n]]->includedFoods[n],{n,1,Length[agriculturalData]}];
This variable removes the values from filteredAgriculturalData and only includes the country names.
I took the values from the filtered data that contained anything from agProducts using its position:
In[]:=
countryAppearance=Flatten[Table[countries[[#]]&/@Flatten[Position[Values[ContainsAny[#,{food}]&/@filteredAgriculturalData],True]],{food,agProducts}]];
If a country produces a certain number of crops listed in agProducts, the country is assigned a digit matching the number of crops it produces that are also listed in agProducts based on filteredAgriculturalData. For example, if a country produces melons, cucumbers, and grapes, the digit will be 3. If a country does not produce any product listed in agProducts, the digit will be 0.
Variable countryDigits counts how many times any elements in agProducts appear within the list of countries:
In[]:=
countryDigits=Count[countryAppearance,#]&/@countries;
I created a scale of five different colors I used to highlight my map with.
This variable represents a scale of five different hues:
In[]:=
colorScale=Table[Hue[n],{n,0,0.5,0.12}];
I created a map that highlights each country based on its produce production.
Variable agMap represents a global map, highlighting countries with the hues in colorScale to correspond to how many agProduct values appear within a certain country:
In[]:=
agMap=GeoGraphics[Table[{EdgeForm[{Thin,Black}],FaceForm[colorScale[[countryDigits[[n]]+1]]],Polygon[countries[[n]]]},{n,1,249}]];
This creates a key for the map.
I made a column with some text, the color scale, and the map:
In[]:=
Column[{Style["Few---->Many",FontFamily->"Times"],Row[colorScale],ImageResize[Image[agMap],3000],Style["Agricultural Production Densities",FontFamily->"Times"]},Center]
In[]:=
Creating Maps of Countries that Grow Particular Produce
Creating Maps of Countries that Grow Particular Produce
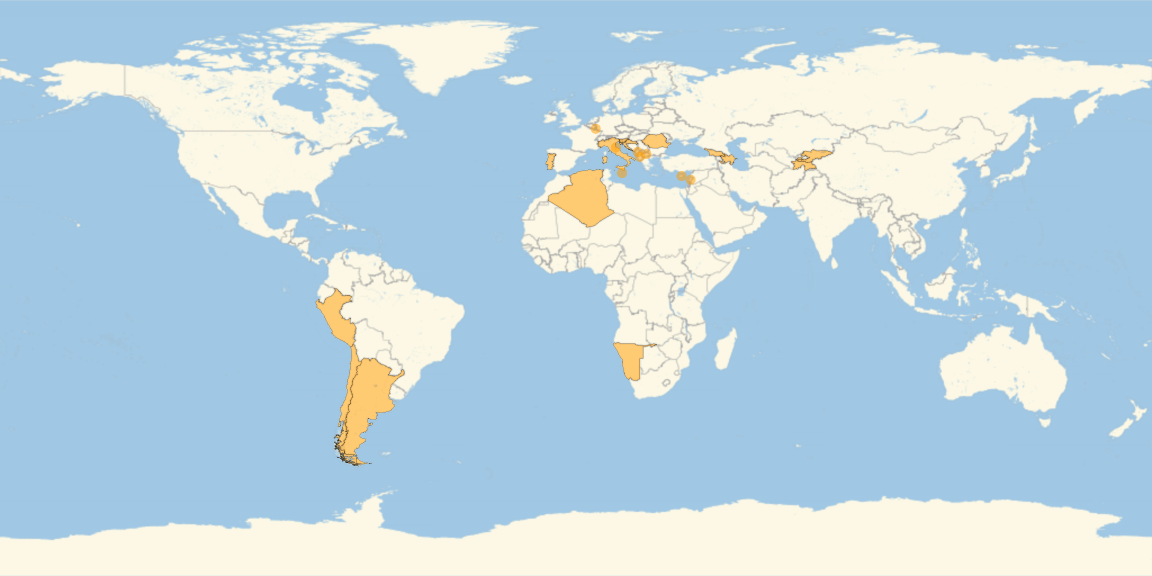
After I created a map highlighting the countries with the most agricultural production, I created an animation showing individual maps highlighting the countries in which specific crops grow. Regions that do not grow a particular crop can consider hydroponic farming instead of importing.
First, I acquired all the relevant crops for a given country.
I created a function that yields True or False to every country based on whether or not it produces a particular crop:
In[]:=
foodSelectedCountries[food_String]:=ContainsAny[#,{food}]&/@filteredAgriculturalData;
I then listed every country that produces a particular relevant crop.
I created a function that lists all of the countries that yield True for a certain crop:
In[]:=
foodWorld[food_String]:=Cases[Partition[Riffle[Keys@foodSelectedCountries[food],Values@foodSelectedCountries[food]],2],{___,True}][[All,1]];
Then, I created maps for each crop that highlight the countries it's grown in.
This variable stores geographic maps for every crop, highlighting the countries it's grown in:
In[]:=
foodMaps=Column[{Style[#,FontFamily->"Times"],GeoListPlot[foodWorld[#],GeoRange->All,ImageSize->Large]},Center]&/@agProducts;
I used the ListAnimate function to create a GIF for all of the maps:
In[]:=
ListAnimate[foodMaps,AnimationRate->0.5]
Out[]=
Exploring Favorable Climates for Crop Farming
Exploring Favorable Climates for Crop Farming
Using a similar approach as my production density map, I made a map that highlights countries based on the favorability of their climates for farming. Countries with adverse conditions for traditional farming methods can look to hydroponic farming as an alternative.
First, I defined a variable that lists the climate types in every country.
I used an association thread to make an association of a country and its climate types from entity data:
In[]:=
rawclimateData=AssociationThread[countries,EntityValue[countries,EntityProperty["Country","ClimateTypes"]]];
I converted the raw data with entities into strings:
In[]:=
climateData=AssociationThread[countries,Table[#["Name"]&/@rawclimateData[[n]],{n,1,Length[rawclimateData]}]];
This variable lists all the climate types that are favorable for farming.
I only needed some of the climate types from entity data, so I defined a list of them as string "farmClimate":
Then, I filtered out any values of climateData that are not in farmClimate from a country.
I used the Intersection function to list the elements in farmClimate that are common to elements in farmClimate. Then, I used the map function to replace "Missing["NotAvailable"]" with an empty list:
These variables store the agricultural products of every country, except it only includes the values listed in farmClimate.
I applied an association to the list of relevant climate types:
This variable removes the values from filteredaClimateData and only includes the country names.
I took the values from the filtered data that contained anything from farmClimate using its position:
If a country has a certain climate type, the country is assigned a digit matching the number of climate types it has that are also listed in farmClimate based on filteredClimateData. For example, if a country has a tropical and temperate climate, the digit will be 2. However, if a country has no climates left after filters are applied, the digit will be 0.
Variable climateDigits counts how many times any elements in farmClimate appear within the list of countries:
I created a scale of seven different colors I used to highlight my map with.
This variable represents a scale of seven different hues:
I created a map that highlights each country based on how favorable the climate is for farming.
Variable climateMap represents a global map, highlighting countries with the hues in colorScale to correspond to how many farmClimate values appear within a certain country:
This creates a key for the map.
I made a column with some text, the color scale, and the map:
Generating a Cumulative Map of Produce Production and Climate
Generating a Cumulative Map of Produce Production and Climate
Finally, I combined the data from my climate and agricultural production maps to create a more accurate map that highlights the suitability of countries for traditional farming.
First, I combined the data for produce production density with the data for climate in each country. I obtained a new total of the amount of climate types and agricultural products each country has and a color scale.
Variables countryDigits and climateDigits are lists of digits with no keys, so the output was a new list of digits:
I defined a new variable totalColorScale as eight different hues that I used to highlight my new map with:
I created a map that highlights each country based on how favorable it is for farming, using production data and climate data.
Variable totalMap represents a global map, highlighting countries with the hues in totalColorScale to correspond to how many farmClimate and agProduct values appear within a certain country:
Then, I added a key.
I made a column with some text, the color scale, and the map:
Acknowledgements
Acknowledgements
The directors, mentors, teaching assistants, and all the other incredible staff at Wolfram truly made my experience working on this project memorable. Their dedication and commitment to this program is admirable, and I have yet to meet a team of people as passionate about their work as they are. Special thanks to my mentor Simeon Buttery who demonstrated nothing but patience, kindness, and optimism throughout the entire process.
CITE THIS NOTEBOOK
CITE THIS NOTEBOOK
Finding locations where hydroponic farming is more favorable based on climate conditions
by Sharon Frid
Wolfram Community, STAFF PICKS, July 13, 2023
https://community.wolfram.com/groups/-/m/t/2964164
by Sharon Frid
Wolfram Community, STAFF PICKS, July 13, 2023
https://community.wolfram.com/groups/-/m/t/2964164