How to convert pediatric lab and vital signs data into a curate dataset?
How to convert pediatric lab and vital signs data into a curate dataset?
Wolfram Community Post: https://community.wolfram.com/groups/-/m/t/2855901
Timothy,
There are several ways to retrieve data from your sources e.g. csv download or web-scraping, intercepting a JSON file or copy-paste via Excel etc.
There are no csv downloads for your sources you posted. The html source code seems not very helpful for web-scraping: tables are not clearly styled by CSS classes; most of the tables have similar in-line styles so I think it will be dificult to target your web content with XML or XPath.
The data retrieval will require a lot of manual intervention.
You can try and select sub-lists with data you can transform with Import:
Import["https://pediamcu.com/172/","Data"]
The other method is to copy-paste the data from these webpages into Excel and then cleanup the data in a format you need and export it to a csv file for Mathematica to process.
You may want to think ahead about the format of data you require for visualization and analysis.
Below is a quick-‘n-dirty data discovery example so you can get the gist of it.
Also at the end I have a few suggestions for training and further reading.
You may want to think ahead about the format of data you require for visualization and analysis.
Below is a quick-‘n-dirty data discovery example so you can get the gist of it.
Also at the end I have a few suggestions for training and further reading.
Example: Newborn Normal Blood Pressure Dataset
Source:https://pediamcu.com/172/
In[]:=
BloodPressure=<|1->{<|"Weight"->Interval[{600,999}],"Systolic"->37.9,"Ssd"->17.4,"Diastolic"->23.2,"Dsd"->10.3|>,<|"Weight"->Interval[{1000,1249}],"Systolic"->44.,"Ssd"->22.8,"Diastolic"->22.5,"Dsd"->13.5|>,<|"Weight"->Interval[{1250,1499}],"Systolic"->48.,"Ssd"->18.,"Diastolic"->27.,"Dsd"->12.4|>,<|"Weight"->Interval[{1500,1750}],"Systolic"->47.,"Ssd"->15.8,"Diastolic"->26.,"Dsd"->15.6|>},1->{<|"Weight"->Interval[{600,999}],"Systolic"->44.9,"Ssd"->15.7,"Diastolic"->30.6,"Dsd"->12.3|>,<|"Weight"->Interval[{1000,1249}],"Systolic"->48.,"Ssd"->15.4,"Diastolic"->36.5,"Dsd"->9.6|>,<|"Weight"->Interval[{1250,1499}],"Systolic"->59.,"Ssd"->21.1,"Diastolic"->40.,"Dsd"->13.7|>,<|"Weight"->Interval[{1500,1750}],"Systolic"->51.,"Ssd"->18.2,"Diastolic"->35.,"Dsd"->10.|>},7->{<|"Weight"->Interval[{600,999}],"Systolic"->50.,"Ssd"->14.8,"Diastolic"->30.4,"Dsd"->12.4|>,<|"Weight"->Interval[{1000,1249}],"Systolic"->57.,"Ssd"->14.,"Diastolic"->42.5,"Dsd"->16.5|>,<|"Weight"->Interval[{1250,1499}],"Systolic"->68.,"Ssd"->14.8,"Diastolic"->40.,"Dsd"->11.3|>,<|"Weight"->Interval[{1500,1750}],"Systolic"->66.,"Ssd"->23.,"Diastolic"->41.,"Dsd"->24.|>},14->{<|"Weight"->Interval[{600,999}],"Systolic"->50.2,"Ssd"->14.8,"Diastolic"->37.4,"Dsd"->12.|>,<|"Weight"->Interval[{1000,1249}],"Systolic"->53.,"Ssd"->30.,"Diastolic"->Missing[],"Dsd"->Missing[]|>,<|"Weight"->Interval[{1250,1499}],"Systolic"->64.,"Ssd"->21.2,"Diastolic"->36.,"Dsd"->24.2|>,<|"Weight"->Interval[{1500,1750}],"Systolic"->76.,"Ssd"->34.8,"Diastolic"->42.,"Dsd"->20.3|>},28->{<|"Weight"->Interval[{600,999}],"Systolic"->61.,"Ssd"->23.5,"Diastolic"->45.8,"Dsd"->27.4|>,<|"Weight"->Interval[{1000,1249}],"Systolic"->57.,"Ssd"->30.,"Diastolic"->Missing[],"Dsd"->Missing[]|>,<|"Weight"->Interval[{1250,1499}],"Systolic"->69.,"Ssd"->31.4,"Diastolic"->44.,"Dsd"->26.2|>,<|"Weight"->Interval[{1500,1750}],"Systolic"->73.,"Ssd"->5.6,"Diastolic"->50.,"Dsd"->9.9|>}|>//Dataset
Out[]=

Let’s select data based on the newborn weight (1600 g) and get one of the original tables:
In[]:=
Transpose@Query[All,Select[IntervalMemberQ[#Weight,1600]&],{"Systolic","Ssd","Diastolic","Dsd"}]@BloodPressure
Out[]=
Visualization
Visualization
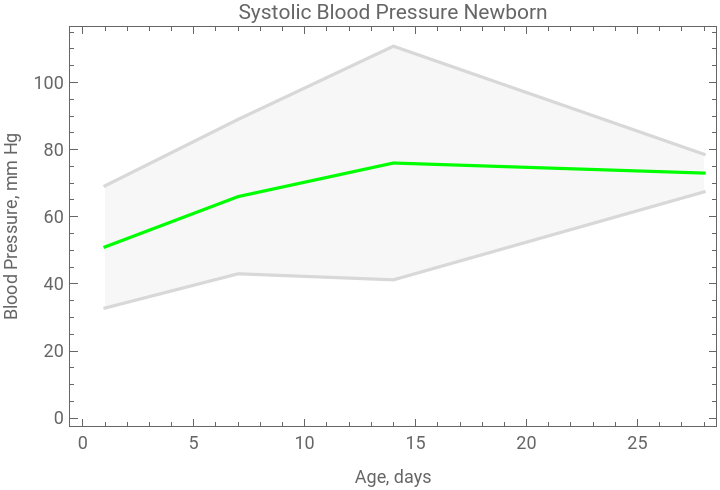
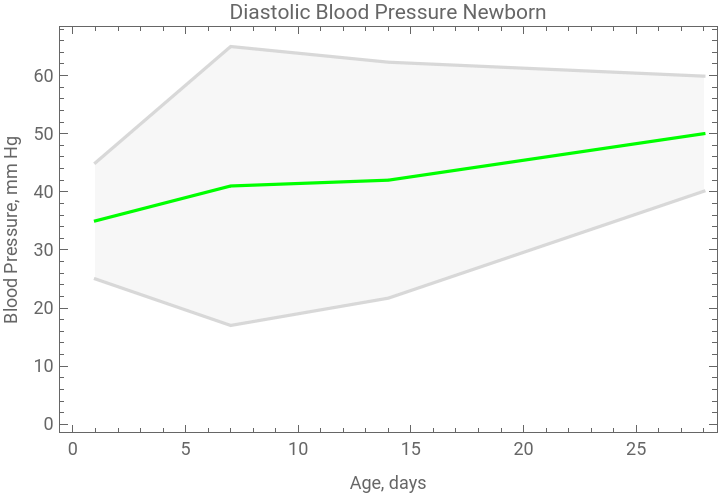
We can plot the systolic and diastolic blood pressure data with standard deviation as bands.
In[]:=
Transpose@{Normal@Keys@BloodPressure,#}&/@Transpose@Flatten[#,1]&@Normal@Query[All,Values,{#Systolic-#Ssd,#Systolic,#Systolic+#Ssd}&]@Transpose@Query[All,Select[IntervalMemberQ[#Weight,1600]&],{"Systolic","Ssd"}]@BloodPressure;ListLinePlot[%,Filling->{1->{2},3->{2}},PlotStyle->{LightGray,Green,LightGray},Frame->True,FrameLabel->{"Age, days","Blood Pressure, mm Hg"},PlotLabel->"Systolic Blood Pressure Newborn"]
Out[]=
In[]:=
Transpose@{Normal@Keys@BloodPressure,#}&/@Transpose@Flatten[#,1]&@Normal@Query[All,Values,{#Diastolic-#Dsd,#Diastolic,#Diastolic+#Dsd}&]@Transpose@Query[All,Select[IntervalMemberQ[#Weight,1600]&],{"Diastolic","Dsd"}]@BloodPressure;ListLinePlot[%,Filling->{1->{2},3->{2}},PlotStyle->{LightGray,Green,LightGray},Frame->True,FrameLabel->{"Age, days","Blood Pressure, mm Hg"},PlotLabel->"Diastolic Blood Pressure Newborn"]
Out[]=
Adding Quantities to the Dataset
If you insist, you can bring in Quantities into the Dataset, but you need to use them in your Queries when processing the Dataset as well.
You could add Quantities as so:
You could add Quantities as so:
In[]:=
f[x_]:=If[!MissingQ@x,Quantity[x,"MillimetersOfMercury"],Missing[]];BloodPressure2=Query[KeyMap[Function[a,Quantity[a,"Days"]],#]&,All]@Query[All,All,<|#,"Weight"->#Weight/.Interval[{x_,y_}]:>Interval[{Quantity[x,"Grams"],Quantity[y,"Grams"]}],"Systolic"->f[#Systolic],"Ssd"->f[#Ssd],"Diastolic"->f[#Diastolic],"Dsd"->f[#Dsd]|>&]@BloodPressure
Out[]=
If you want to select the Newborn Blood Pressure subset of the age of 1 Day old, you need to inlcude Quanties as so:
Interactive online Wolfram-U courses
References
References