Allan Plot of an Oscillator with Deterministic Perturbations
Allan Plot of an Oscillator with Deterministic Perturbations


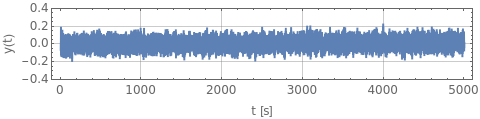
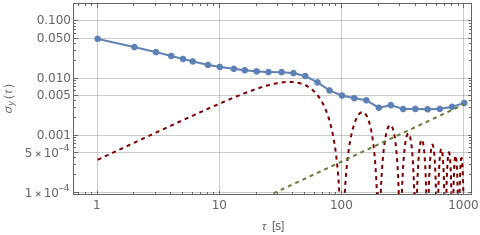
The Allan deviation (τ) is a statistical measure of the relative frequency instability of an oscillator on a sampling period . This Demonstration simulates an oscillator having white frequency noise plus deterministic perturbations. The upper graph shows the time series of relative frequency fluctuations and the lower graph shows the corresponding Allan plot (τ). You can modify the noise amplitude, add a drift or an oscillation, and observe the resulting change in Allan deviation. Each of the three perturbations contributes to the Allan deviation as follows: the white frequency noise gives rise to (τ)∝, the linear drift adds a contribution (τ)=dτ (green curve), and the oscillation results in (τ)=b(πτ/T) (red curve).
σ
y
τ
y(t)=(ν(t)-)/
ν
0
ν
0
σ
y
σ
y
-1/2
τ
y(t)=dt
σ
y
-1/2
2
y(t)=bcos(2πt/T)
σ
y
2
sin(πτ/T)
Details
Details
Snapshot 1: oscillator with white frequency noise
Snapshot 2: oscillator with white frequency noise plus a deterministic oscillation
Snapshot 3: oscillator with white frequency noise plus a linear drift
The Allan deviation (τ) is the square root of the Allan variance defined by:
σ
y
2
σ
y
1
2
2
-
τ
y
n+1
τ
y
n
where is the relative frequency fluctuations average over the integration time .
τ
y
n
th
n
τ
References
References
[1] C. Audoin and B. Guinot, The Measurement of Time, Cambridge: Cambridge University Press, 2001.
[2] J. Vanier and C. Audoin, The Quantum Physics of Atomic Frequency Standards, Philadelphia: Hilger, 1989.
Permanent Citation
Permanent Citation
Gianni Di Domenico
"Allan Plot of an Oscillator with Deterministic Perturbations"
http://demonstrations.wolfram.com/AllanPlotOfAnOscillatorWithDeterministicPerturbations/
Wolfram Demonstrations Project
Published: March 7, 2011