Co-Gasification of Two Biomasses (Mathematica vs. Aspen-Plus)
Asma Hammami, Housam Binous, Hatem Dhaouadi and Ahmed Bellagi
Co-Gasification of Two Biomasses (Mathematica vs. Aspen-Plus)
Asma Hammami, Housam Binous, Hatem Dhaouadi and Ahmed Bellagi
Asma Hammami, Housam Binous, Hatem Dhaouadi and Ahmed Bellagi
We consider olive pomace + grape marc gasification (or biomass co-gasification) in the presence of both oxygen and steam (auto-thermal gasification).
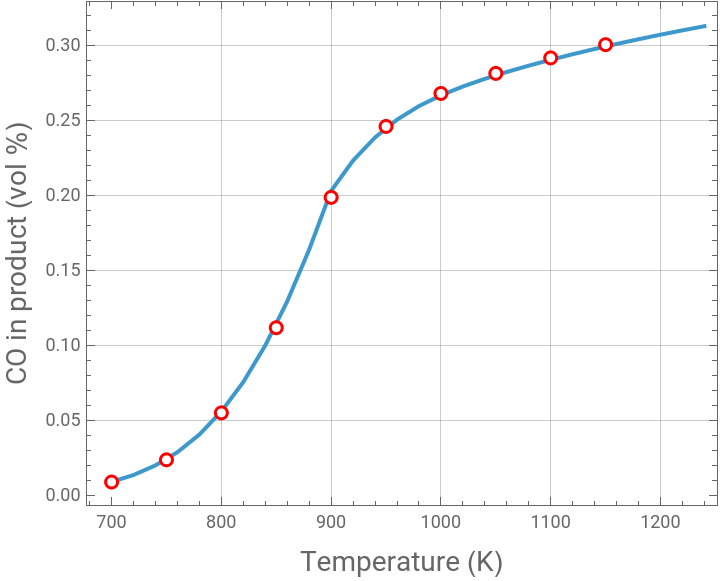
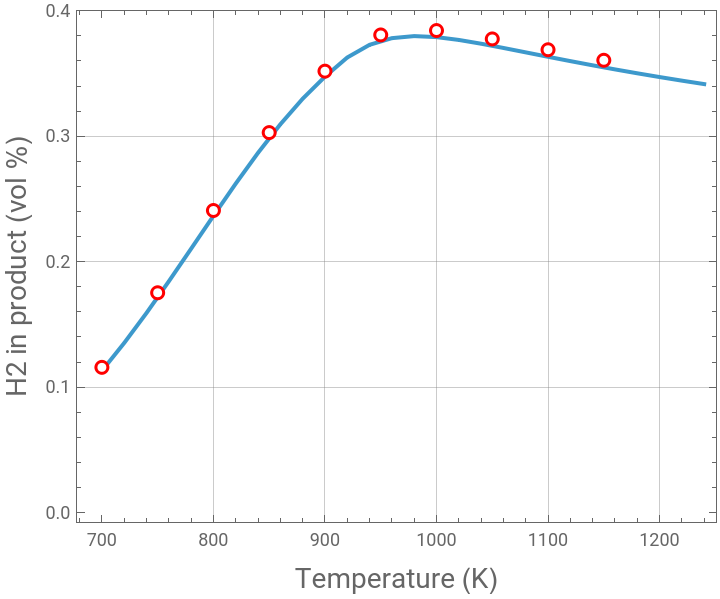
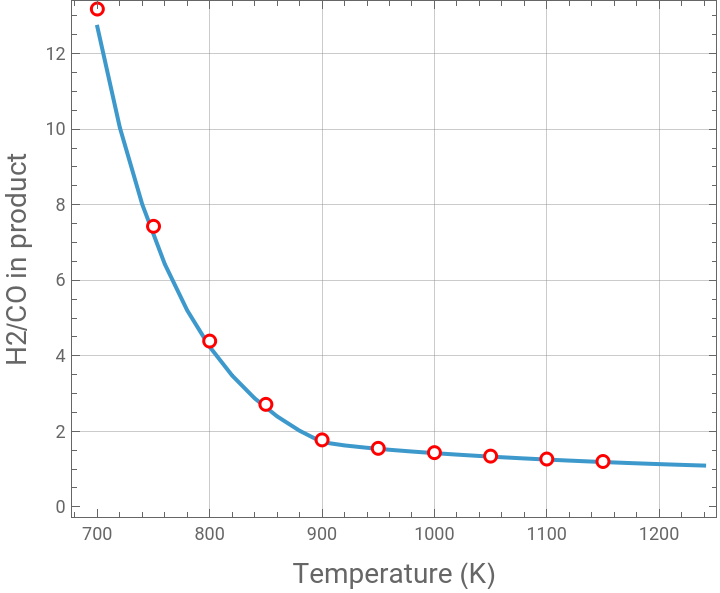
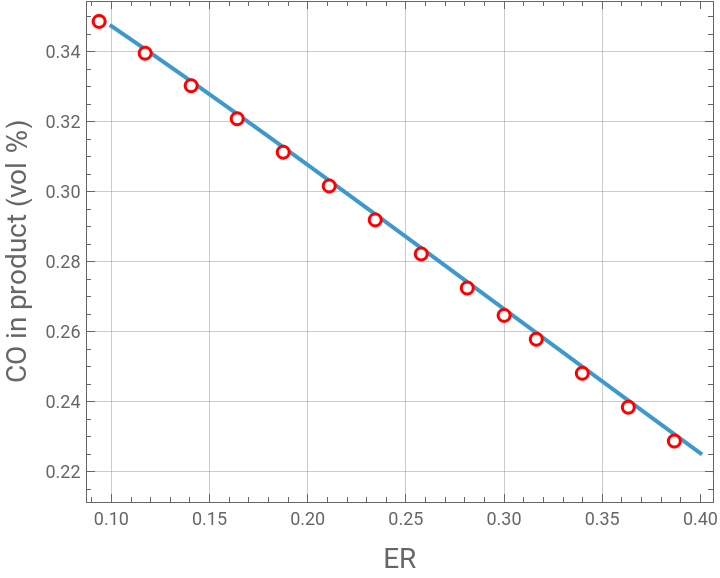
We investigate (1) the effect of temperature and (2) Equivalence Ratio with fixed Steam-Biomass Ratio (SBR) on H2, CO mole fractions and H2/CO ratio.
Based on proximate and ultimate analyses, given in Ref. 1 and 2, Tunisian olive pomace is modeled as a pseudo-compound whose formula is while grape marc is modeled as (when Sulfur is neglected).
References:
[1] R. Tilouche, R. Garma, H. Binous and A. Bellagi, Valorization of Tunisian olive pomace by steam gasification: thermodynamic study using Mathematica© and Aspen-plus®, Biomass Conv. Bioref., 14, 16499–16514 (2024). https://doi.org/10.1007/s13399-023-04167-z
[2] A. Getaye, S. Vaudreuil, T. Bounahmidi and T. Moudakkar, Hydrogen-rich syngas production from agro-food waste: catalytic steam gasification of olive pomace and grape marc using Ni and CaO catalysts, Sustainable Chemistry and Pharmacy, Volume 48, 2025, 102270, https://doi.org/10.1016/j.scp.2025.102270
We investigate (1) the effect of temperature and (2) Equivalence Ratio with fixed Steam-Biomass Ratio (SBR) on H2, CO mole fractions and H2/CO ratio.
Based on proximate and ultimate analyses, given in Ref. 1 and 2, Tunisian olive pomace is modeled as a pseudo-compound whose formula is
C
1
H
1.5403
O
0.5318
N
0.0236
C
1
H
1.5276
O
0.8396
N
0.0356
References:
[1] R. Tilouche, R. Garma, H. Binous and A. Bellagi, Valorization of Tunisian olive pomace by steam gasification: thermodynamic study using Mathematica© and Aspen-plus®, Biomass Conv. Bioref., 14, 16499–16514 (2024). https://doi.org/10.1007/s13399-023-04167-z
[2] A. Getaye, S. Vaudreuil, T. Bounahmidi and T. Moudakkar, Hydrogen-rich syngas production from agro-food waste: catalytic steam gasification of olive pomace and grape marc using Ni and CaO catalysts, Sustainable Chemistry and Pharmacy, Volume 48, 2025, 102270, https://doi.org/10.1016/j.scp.2025.102270
In[]:=
In[]:=
sol[{x_,ER_,r_}]:=Quiet@FindMinimum[{Re[Gtot[x,P]],{n[7]<1/1000000,n[1]>0,n[2]>0,n[3]>0,n[4]>0,n[5]>0,n[6]>0,n[7]>0,n[8]>0,n[9]>0,n[10]>0},n[1]+n[5]+n[4]+n[10]1+1,4n[1]+2n[2]+2n[3]1.5403+1.5276+2r,n[3]+n[4]+2n[5]+n[6]+2n[7]+2n[9]0.531858+0.73504+r+2ER2.133546,n[6]+n[7]+2n[8]0.0236+0.0406},Table[{n[j],0.07},{j,1,10}],MaxIterations10000,AccuracyGoal5];(*xistemperature,ERisequivalenceratioandrisSBR*)
In[]:=
P=1;
Temperature effect on H2 and CO
In[]:=
ER2.133546/.ER->0.3
Out[]=
0.640064
In[]:=
P=1;
In[]:=
tbl=Table[{T,y[4]/.sol[{T,0.3,1.0}][[2]]},{T,700,1250,20}];
In[]:=
p1=ListPlot[tbl,PlotRange->All,Frame->True,AspectRatio->0.8,GridLines->Automatic,Joined->True,FrameLabel->{Style["Temperature (K)",14],Style["CO in product (vol %)",14]}];
In[]:=
(*ASPEN*)tbl2={{700,0.00878392451},{750,0.0235899842},{800,0.0548682195},{850,0.111610988},{900,0.198481431},{950,0.24576378},{1000,0.267740184},{1050,0.281110915},{1100,0.291429276},{1150,0.300262951}};
In[]:=
p2=ListPlot[tbl2,PlotMarkers->"OpenMarkers",PlotStyle->Red];(*Aspenresultsarerepresentedusingredopenmarkers*)
In[]:=
Show[p1,p2]
Out[]=
In[]:=
tbl=Table[{T,y[2]/.sol[{T,0.3,1.0}][[2]]},{T,700,1250,20}];
In[]:=
p1=ListPlot[tbl,PlotRange->All,Frame->True,AspectRatio->0.8,GridLines->Automatic,Joined->True,FrameLabel->{Style["Temperature (K)",14],Style["H2 in product (vol %)",14]}];
In[]:=
(*ASPEN*)tbl2={{700,0.115795595},{750,0.175240946},{800,0.240825081},{850,0.30292395},{900,0.351882152},{950,0.380756208},{1000,0.384260378},{1050,0.377576508},{1100,0.368943167},{1150,0.360567693}};
In[]:=
p2=ListPlot[tbl2,PlotMarkers->"OpenMarkers",PlotStyle->Red];(*Aspenresultsarerepresentedusingredopenmarkers*)
In[]:=
Show[p1,p2]
Out[]=
In[]:=
tbl=Table[{T,y[2]/y[4]/.sol[{T,0.3,1.0}][[2]]},{T,700,1250,20}];
In[]:=
p1=ListPlot[tbl,PlotRange->All,Frame->True,AspectRatio->0.8,GridLines->Automatic,Joined->True,FrameLabel->{Style["Temperature (K)",14],Style["H2/CO in product",14]}];
In[]:=
(*ASPEN*)tbl2={{700,13.182625},{750,7.4285911},{800,4.38913977},{850,2.71409635},{900,1.77286628},{950,1.54929259},{1000,1.43521339},{1050,1.34317162},{1100,1.26599009},{1150,1.20085025}};
In[]:=
p2=ListPlot[tbl2,PlotMarkers->"OpenMarkers",PlotStyle->Red];(*Aspenresultsarerepresentedusingredopenmarkers*)
In[]:=
Show[p1,p2]
Out[]=
ER effect on H2 and CO
In[]:=
tbl=Table[{ER,y[4]/.sol[{1000,ER,1.0}][[2]]},{ER,0.1,0.4,0.02}];
In[]:=
p1=ListPlot[tbl,PlotRange->All,Frame->True,AspectRatio->0.8,GridLines->Automatic,Joined->True,FrameLabel->{Style["ER",14],Style["CO in product (vol %)",14]}];
In[]:=
(*ASPEN*)tbl2={{0.2,0.348689977},{0.225,0.344176906},{0.25,0.339605566},{0.275,0.334983173},{0.3,0.330316225},{0.325,0.325610577},{0.35,0.320871498},{0.375,0.316103739},{0.4,0.31131158},{0.425,0.306498884},{0.45,0.301669144},{0.475,0.296825518},{0.5,0.291970867},{0.525,0.28710779},{0.55,0.282238647},{0.575,0.277365588},{0.6,0.272490572},{0.625,0.267615391},{0.64005,0.264681143},{0.65,0.262741682},{0.675,0.257870946},{0.7,0.253004561},{0.725,0.248143793},{0.75,0.243289807},{0.775,0.238443677},{0.8,0.233606393},{0.825,0.228778872},{0.85,0.223961959},{0.875,0.21915644},{0.9,0.214363039}};
In[]:=
tbl2=Table[{tbl2[[i]][[1]]/2.133546,tbl2[[i]][[2]]},{i,1,Length@tbl2,2}]
Out[]=
{{0.0937407,0.34869},{0.117176,0.339606},{0.140611,0.330316},{0.164046,0.320871},{0.187481,0.311312},{0.210916,0.301669},{0.234352,0.291971},{0.257787,0.282239},{0.281222,0.272491},{0.299994,0.264681},{0.316375,0.257871},{0.33981,0.248144},{0.363245,0.238444},{0.38668,0.228779},{0.410115,0.219156}}
In[]:=
p2=ListPlot[tbl2,PlotMarkers->"OpenMarkers",PlotStyle->Red];(*Aspenresultsarerepresentedusingredopenmarkers*)
In[]:=
Show[p1,p2]
Out[]=
In[]:=
tbl=Table[{ER,y[2]/.sol[{1000,ER,1.0}][[2]]},{ER,0.1,0.4,0.02}];
In[]:=
p1=ListPlot[tbl,PlotRange->All,Frame->True,AspectRatio->0.8,GridLines->Automatic,Joined->True,FrameLabel->{Style["Temperature (K)",14],Style["H2 in product (vol %)",14]}];
In[]:=
(*ASPEN*)tbl2={{0.2,0.461220658},{0.225,0.457764081},{0.25,0.454112467},{0.275,0.450282796},{0.3,0.446290208},{0.325,0.442148197},{0.35,0.437868798},{0.375,0.433462753},{0.4,0.428939656},{0.425,0.42430809},{0.45,0.41957574},{0.475,0.414749499},{0.5,0.40983556},{0.525,0.404839496},{0.55,0.399766327},{0.575,0.39462059},{0.6,0.389406385},{0.625,0.384127431},{0.64005,0.380919702},{0.65,0.3787871},{0.675,0.373388462},{0.7,0.367934312},{0.725,0.362427201},{0.75,0.356869461},{0.775,0.351263228},{0.8,0.345610461},{0.825,0.33991296},{0.85,0.334172383},{0.875,0.328390257},{0.9,0.322567993}};
In[]:=
tbl2=Table[{tbl2[[i]][[1]]/2.133546,tbl2[[i]][[2]]},{i,1,Length@tbl2,2}]
Out[]=
{{0.0937407,0.461221},{0.117176,0.454112},{0.140611,0.44629},{0.164046,0.437869},{0.187481,0.42894},{0.210916,0.419576},{0.234352,0.409836},{0.257787,0.399766},{0.281222,0.389406},{0.299994,0.38092},{0.316375,0.373388},{0.33981,0.362427},{0.363245,0.351263},{0.38668,0.339913},{0.410115,0.32839}}
In[]:=
p2=ListPlot[tbl2,PlotMarkers->"OpenMarkers",PlotStyle->Red];(*Aspenresultsarerepresentedusingredopenmarkers*)
In[]:=
Show[p1,p2]