In[]:=
data=Import["https://www.wolframcloud.com/obj/76e44332-cbbe-42b9-9805-42b79fa20d5b"];
select time series of confirmed cases
In[]:=
ts[ctry_]:=Query[Select[#Countryctry&]/*Total,"ConfirmedCases"]@data
In[]:=
ctries=ts/@,,,,;
remove missing data
In[]:=
ctries=(#/.Missing["NotAvailable"]0&)/@ctries;
collect the time series of all countries in Europe in one
In[]:=
euro=QuerySelect#Country["Continent"]&/*Total,"ConfirmedCases"@data;

In[]:=
euro=(euro/.Missing["NotAvailable"]0);
In[]:=
AppendTo[ctries,euro];
In[]:=
lbls=#["Name"]&/@,,,,;
In[]:=
AppendTo[lbls,"Europe"];
choose a time window
In[]:=
tw[ts_]:=TimeSeriesWindowts,Today-1,Today-1-4
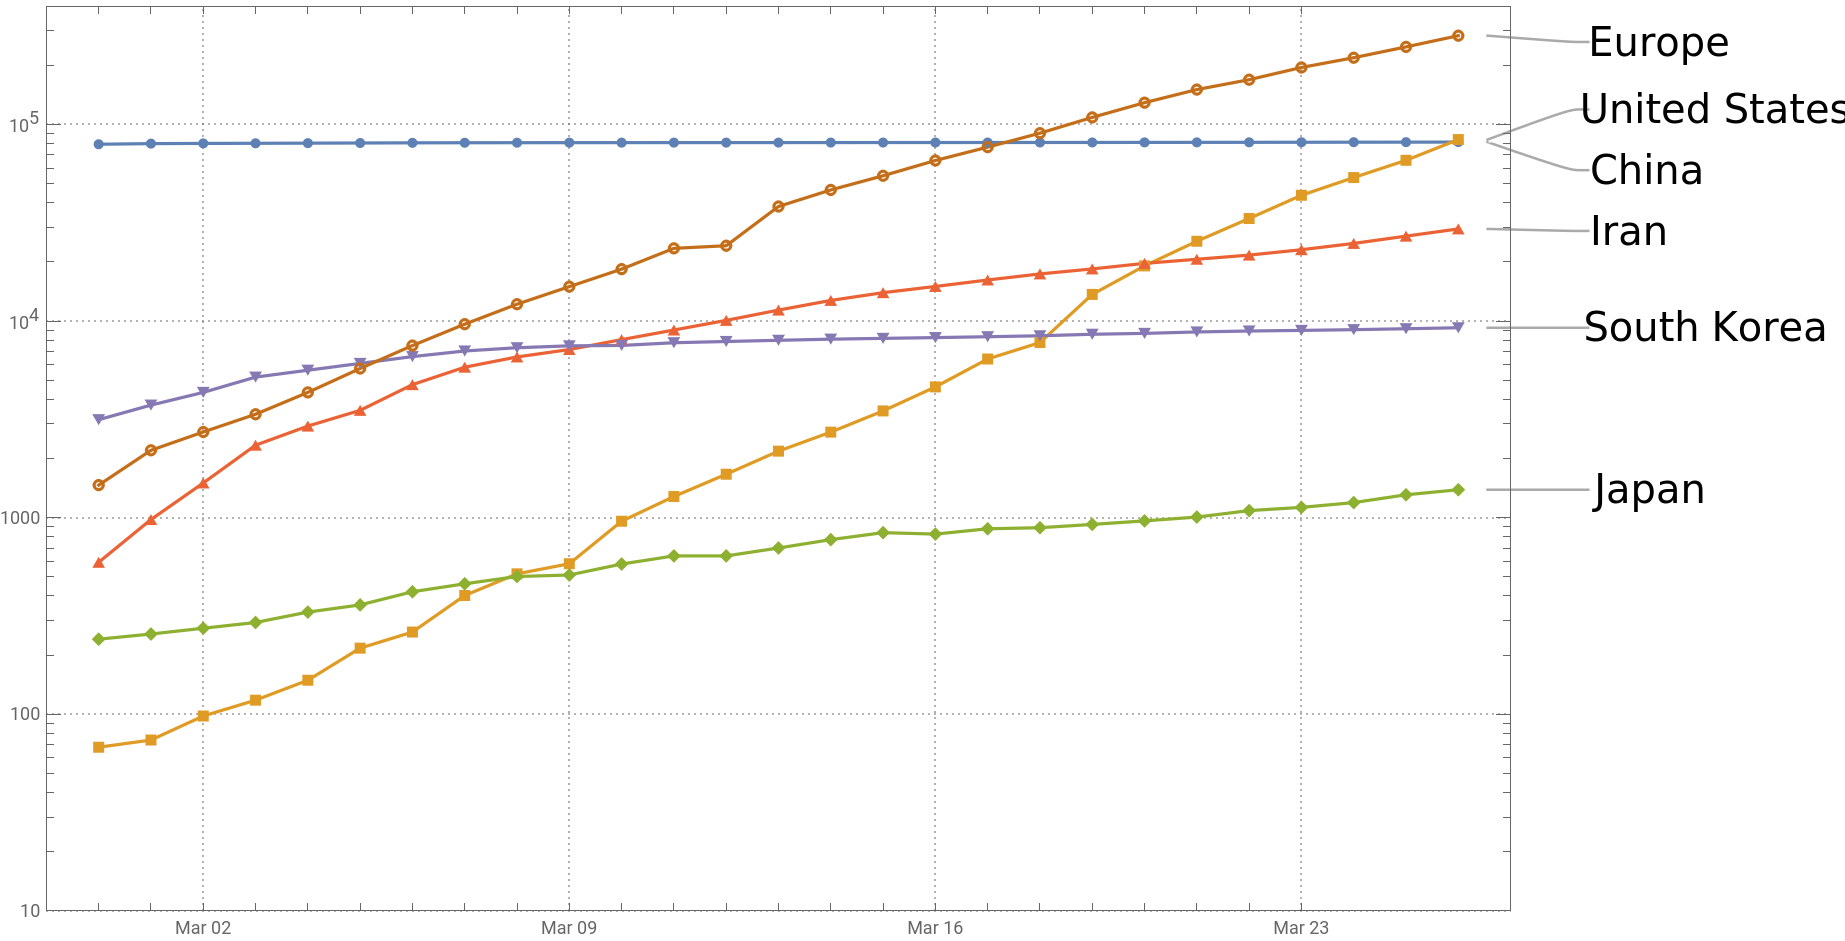
plot the historic data in a chosen time window
In[]:=
(tw/@ctries)//DateListLogPlot#,PlotRangeToday-4-1,Today-1,{10,410^5},PlotLabelslbls,ImageSizeFull,BaseStyle{FontSize20},PlotMarkersAutomatic,PlotTheme"Detailed"&
Out[]=
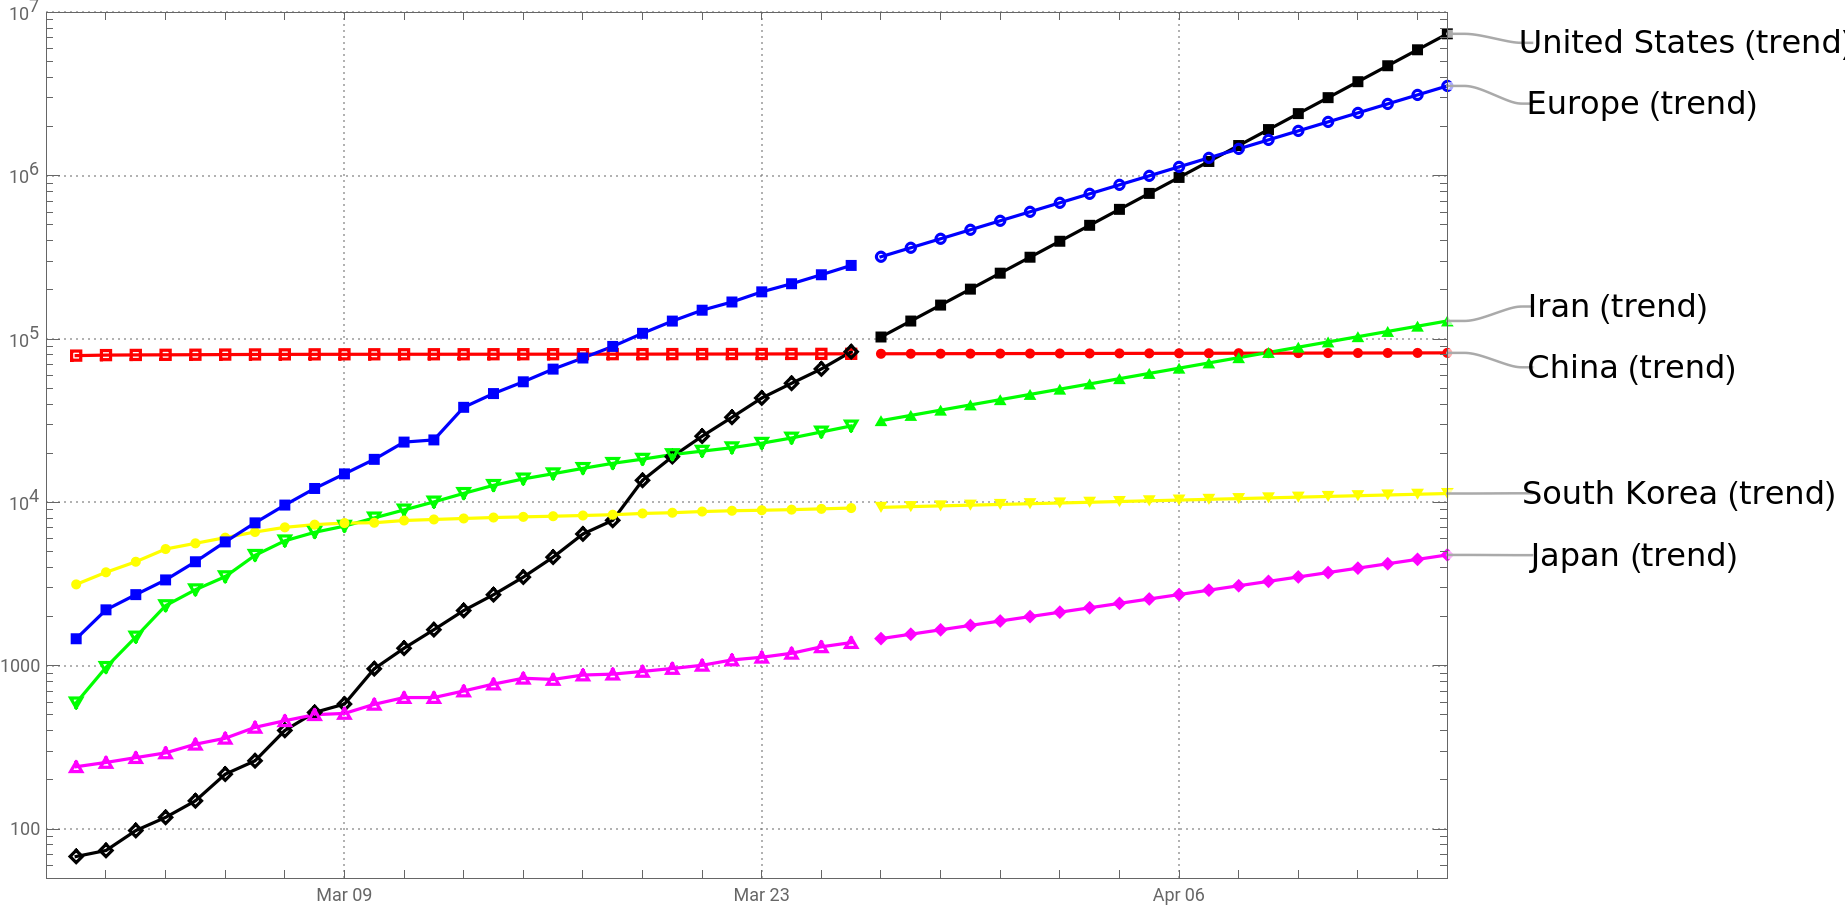
do a simple exponential fit to the data from the last 8 days
In[]:=
trend[rgn_,cutoff_]:=Module{max=Max[Normal[rgn][[;;,2]]],top,pdays,nlm,maxdate,maxdays},top=Select[rgn//Normal,#[[2]]>max/10&];pdays=({QuantityMagnitude[#[[1]]-Today],#[[2]]}&)/@top;nlm=NonlinearModelFit[Take[pdays,-8],cExp[αx],{c,α},x];maxdays=Values[Flatten[NSolve[Normal[nlm]cutoff,x]]];maxdays=Min[maxdays,18];TimeSeriesTableToday+x,Normal[nlm],{x,-1,maxdays}
plot the historic data and the trend for the next 18 days
In[]:=
DateListLogPlotJoin[trend[#,10000000]&/@ctries,tw/@ctries],PlotRangeToday-4-1,Today+18,{50,1010^6},PlotStyle{Red,Black,Magenta,Green,Yellow,Blue,Red,Black,Magenta,Green,Yellow,Blue},PlotLabels(#<>" (trend)"&/@lbls),ImageSizeFull,BaseStyle{FontSize16},PlotMarkersAutomatic,PlotTheme"Detailed"
Out[]=