Cobweb Diagram of the Logistic Map
Cobweb Diagram of the Logistic Map


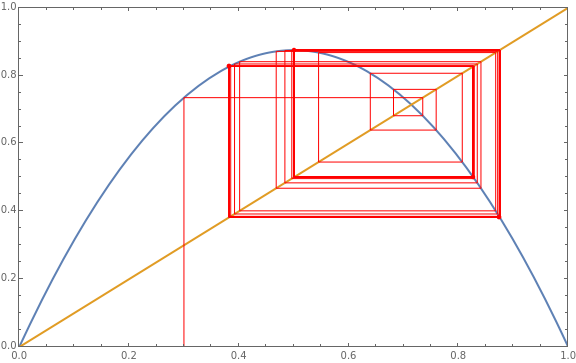
The logistic map, a popular example of a period-doubling cascade developing to chaos, obeys the recurrence =r(1-). The red cobweb diagram traces out the orbit of for a given value of the parameter . The orbit is chaotic when the cobweb diagram becomes dense.
x
n
x
n-1
x
n-1
x
r
Use the "" slider to see periodic or chaotic orbits or one with a fixed point as the limit.
r
Use the "" slider to change the starting value. For a suitably high number of dropped iteration, the starting value should have a negligible affect on the plot, except in the chaotic regime.
x
0
Use the "number of iterations" slider to set the maximum chosen for plotting .
n
x
n
Use the "number of dropped iterations" slider to set the number of the initial iterations that are not included in the plot. If , no iterations are dropped.
n=0
Details
Details
Snapshot 1: period 2 orbit
Snapshot 2: period 4 orbit
Snapshot 3: chaotic orbit
External Links
External Links
Permanent Citation
Permanent Citation
Kevin Reiss
"Cobweb Diagram of the Logistic Map"
http://demonstrations.wolfram.com/CobwebDiagramOfTheLogisticMap/
Wolfram Demonstrations Project
Published: May 20, 2021