Introduction
Introduction
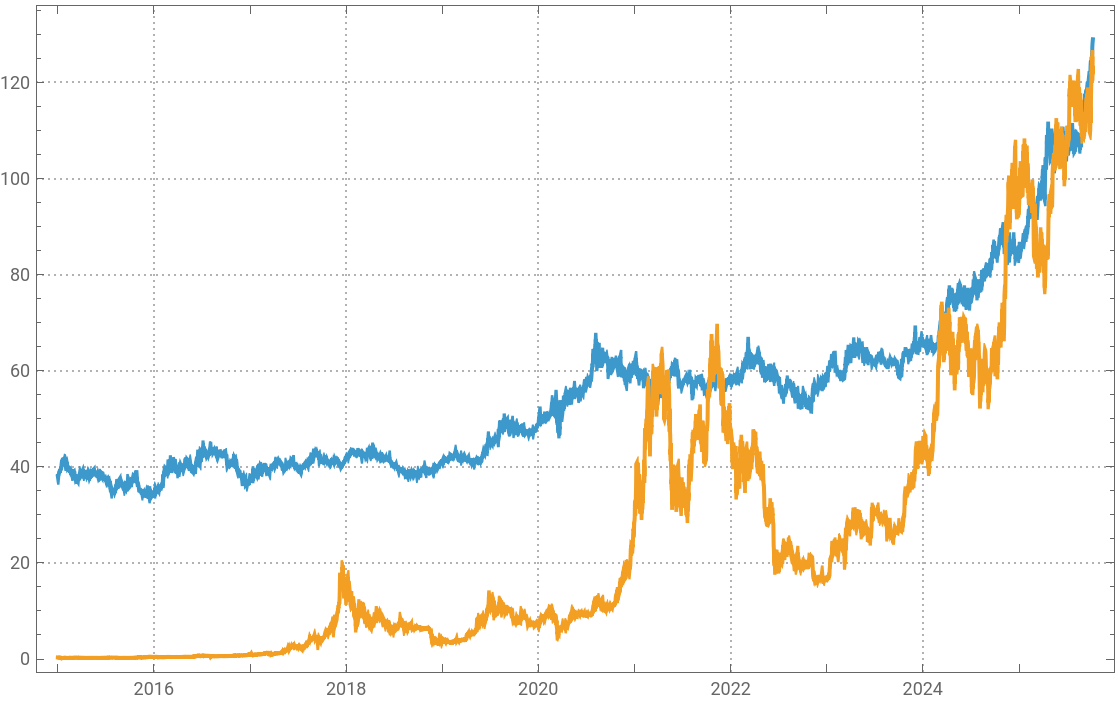
Gold surges OCT 8, 2025. Since nowadays we can buy a gold bar at COSTCO, I thought I demonstrate my recent observation on viewing gold in different units - kilograms. Those you cannot buy at COSTCO, but they it’s a “golden standard” (pun intended) and remarkably recently its price is waltzing with 1 Bitcoin pretty tightly. Usually people do not notice this because gold standardly is listed for much smaller unit of mass.
I have noticed that bitcoin price is about roughly the price of 1kg of gold past year. One can easily verify this at Wolfram Alpha:
In[]:=
Out[]=
1.021
Or simply checking online:
The price of gold is standardly given for the value of one troy ounce -- an equivalent to roughly 31 grams:
In[]:=
UnitConvert,"Grams"//N
Out[]=
So when the price of gold is listed it is not immediately obvious what value 1kg of gold has, unless one does the unit conversion.
Current gold surge
Current gold surge
◼
Gold futures rise above $4,000 per ounce for the first time
◼
Gold Tops $4,000 for First Time Fueled by US Shutdown
◼
Anxious Investors Push Gold Above $4,000 an Ounce for the First Time
Importing data
Importing data
Start from importing bitcoin (BTC) data valued in US$:
In[]:=
FinancialData["BTC/USD",{2015},Method->"Legacy"]BTCdata=TimeSeries@%
Out[]=
Out[]=
TimeSeries


As I mentioned earlier, imported gold price data is usually given for the value of one troy ounce of gold. It is equivalent of roughly 31 grams. To convert price for 1kg of gold we need to compute the multiplication factor proportionally to masses ratio:
In[]:=
N
Out[]=
32.1507
Hence, the price data for 1kg of gold is obtained as:
In[]:=
FinancialData["XAU/USD",{2015},Method->"Legacy"];MapAtN#&,%,{All,2}GoldData=TimeSeries@%
Out[]=
Out[]=
TimeSeries

Finally the plot is computed as:
In[]:=
DateListPlot[{GoldData,BTCdata},PlotTheme->"Detailed"]
Out[]=
Alternative data methods: Entity framework and more
Alternative data methods: Entity framework and more
Entity framework is another excellent method to get financial data. Consider this code extracting out gold data in a different way:
In[]:=
Entity["Element","Gold"][Dated[EntityProperty["Element","Price"],DateInterval[{{2015},Today}]]]
Out[]=
TimeSeries

Properly formatted it looks compact and nice:
In[]:=
Out[]=
TimeSeries
For bitcoin we can use another alternative method of . It uses exchange rate information provided by for conversion between currency units.
In[]:=
CurrencyConvert["BTC","USDollars",{{2015},Today}]
Out[]=
TimeSeries
Final graphics design
Final graphics design
In[]:=
header=Style["Post-COVID Convergence: 1 Bitcoin and 1kg Gold",43,GrayLevel[.9],FontFamily->"DIN Condensed"];sub1=Style"🔒 GOLD: safety asset 🔥 BITCOIN: risk asset",20,GrayLevel[.75],FontFamily->"Georgia";sub2=Style" 🦋 Is perception changing?",20,GrayLevel[.75],FontFamily->"Georgia";footer1=Style["Data | Tools: WOLFRAM Language",15,GrayLevel[.5],FontFamily->"Verdana"];footer2=Style"𝕏.com/SUPERFLOW",15,GrayLevel[.5],FontFamily->"Verdana";Framed[Column[{header,Row[{sub1,sub2}],"",DateListPlot[{GoldData,BTCdata},PlotTheme->"Detailed",PerformanceGoal->"Speed",PlotStyle->{,},FrameStyle->GrayLevel[.75],BaseStyle->19,ImageSize->700,AspectRatio->.55/GoldenRatio,FrameTicks->{{{{40000,"40K"},{80000,"80K"},{120000,"120K"}},None},{Automatic,None}},PlotLegends->Placed[Style[#,21,GrayLevel[.75],FontFamily->"Copperplate"]&/@{"Gold, 1kg, USD","Bitcoin, BTC, USD"},{Left,Top}],Epilog->{Text[Style["COVID",21,GrayLevel[.75],FontFamily->"Copperplate"],{AbsoluteTime[{2020,3,11}],105000},{Left,Bottom}],{,Thickness[.005],Arrow[{{AbsoluteTime[{2020,3,11}],105000},{AbsoluteTime[{2020,3,11}],60000}}]}}],DateListPlot[{GoldData,BTCdata},PlotTheme->"Detailed",PerformanceGoal->"Speed",PlotStyle->{,},BaseStyle->19,FrameStyle->GrayLevel[.75],ImageSize->700,AspectRatio->.55/GoldenRatio,FrameTicks->{{{{40000,"40K"},{80000,"80K"},{120000,"120K"}},None},{Automatic,None}},PlotRange->{{{2020,1,1},Now},All},Epilog->{,Thickness[.005],Arrow[{{AbsoluteTime[{2020,3,11}],105000},{AbsoluteTime[{2020,3,11}],60000}}]}],DateListPlot[BTCdata/GoldData,PlotTheme->"Detailed",PerformanceGoal->"Speed",PlotStyle->Cyan,BaseStyle->19,FrameStyle->GrayLevel[.75],PlotStyle->Red,ImageSize->700,Filling->1,AspectRatio->.55/GoldenRatio,FrameTicks->{{{.2,.6,1,1.4},None},{Automatic,None}},PlotRange->{{{2020,1,1},Now},{0,1.4}},FrameLabel->{None,Style["",0]},PlotLegends->Placed[Style["1 BTC / 1kg GOLD, in USD",GrayLevel[.9],21,FontFamily->"Copperplate"],{Left,Top}],Epilog->{{Green,Dashed,Thickness[.005],Line[{{AbsoluteTime[{2010,3,11}],1},{AbsoluteTime[{2030,3,11}],1}}]},{,Thickness[.005],Arrow[{{AbsoluteTime[{2020,3,11}],.7},{AbsoluteTime[{2020,3,11}],.3}}]}}],"",Row[{footer1,Spacer[300],footer2}]},Alignment->Center],Background->Black,FrameMargins10]

CITE THIS NOTEBOOK
CITE THIS NOTEBOOK
Post-COVID Convergence: 1 BITCOIN and 1kg GOLD
by Vitaliy Kaurov
Wolfram Community, STAFF PICKS, October 9, 2025
https://community.wolfram.com/groups/-/m/t/3558536
by Vitaliy Kaurov
Wolfram Community, STAFF PICKS, October 9, 2025
https://community.wolfram.com/groups/-/m/t/3558536