Laminar Friction Factors for a Concentric Annulus
Authors: Housam Binous and Ahmed Bellagi
Laminar Friction Factors for a Concentric Annulus
Authors: Housam Binous and Ahmed Bellagi
Authors: Housam Binous and Ahmed Bellagi
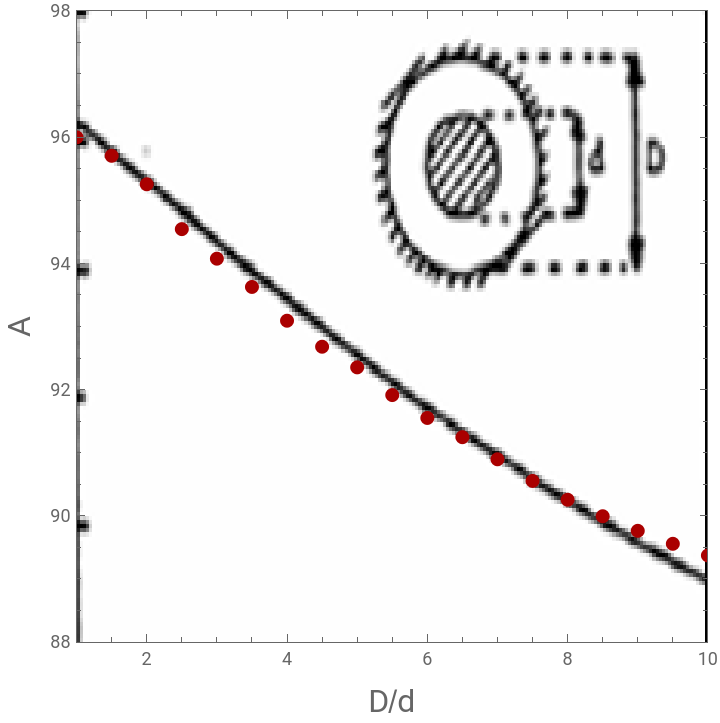
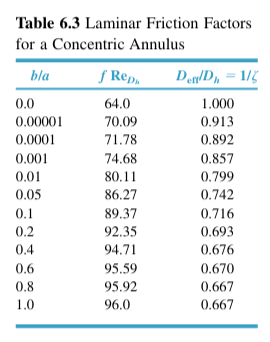
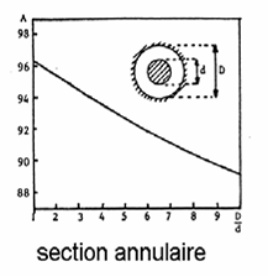
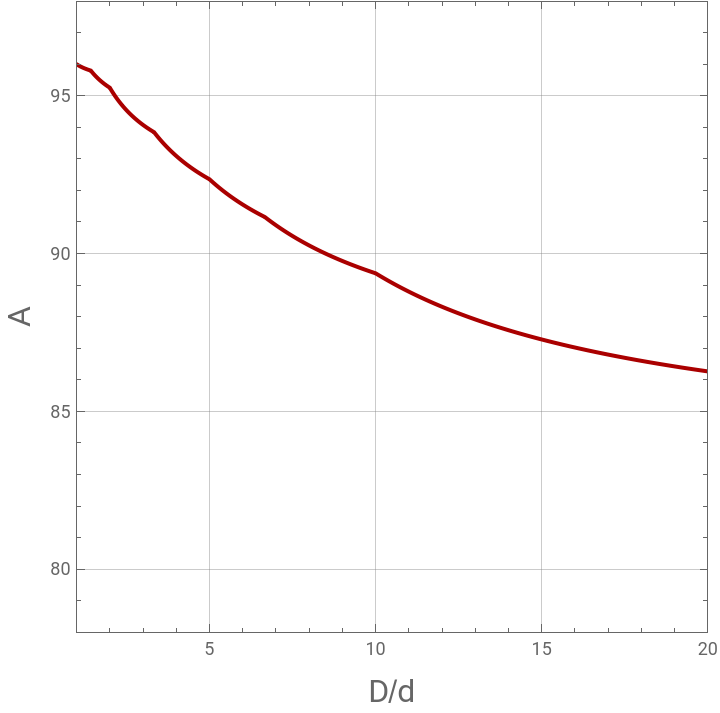
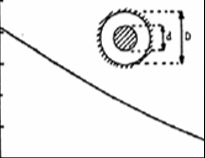
The friction factors for concentric annulus at low Reynolds numbers are given by . Hence, where is a shape factor, which depends on b/a. Some numerical values of and /=1/ζ are given in Table 6.3. Here, we reproduce this Table.A plot of A versus D/d has been reported previously. Here, we also plot A versus D/d.References:[1] O. C. Jones, Jr., J. C. M. Leung, An Improvement in the Calculation of Turbulent Friction in Smooth Concentric Annuli, J. Fluids Eng., Dec 1981, 103(4): 615-623. DOI: 10.1115/1.3241781[2] Frank M. White, Fluid Mechanics, 4th edition, McGraw-Hill, 2000.
f==
A
Re
Dh
64
Re
eff
A=64*ζ
ζ

f*
Re
Dh
D
eff
D
h
In[]:=
(*RadiusratioandcorrespondingshapefactorfromRef.1*)ratio={0.0,10^-8,10^-5,10^-3,10^-2,0.05,0.10,0.15,0.20,0.30,0.50,0.70,1.00};shapeFactor={1.0,0.9457,0.9132,0.8569,0.7989,0.7419,0.7161,0.7021,0.6930,0.6820,0.6719,0.6681,0.6667};
In[]:=
(*interpolationfunction*)factor=Interpolation[Transpose[{ratio,shapeFactor}],InterpolationOrder->1];
In[]:=
ratioTable={0.0,0.00001,0.001,0.01,0.05,0.1,0.2,0.4,0.6,0.8,1.0};
In[]:=
(*DataintheformofaTablesimilartoTable6.3ofRef.2*)Grid[Prepend[Transpose[{ratioTable,64/factor[ratioTable],factor[ratioTable]}],{"Radius ratio b/a","f*Re_Dh","Shape factor 1/ζ"}],Frame->All,Background->{None,{Lighter[Blend[{Blue,Red}],.3],{Lighter[Blend[{Blue,Darker@Red}],.8],Lighter[Red,.9]}}},ItemSize->{8.4,2.0},Frame->Darker[Gray,.6],ItemStyle->14,Spacings->{Automatic,.8}]
Out[]=
Radius ratio b/a | f*Re_Dh | Shape factor 1/ζ |
0. | 64. | 1. |
0.00001 | 70.0832 | 0.9132 |
0.001 | 74.6878 | 0.8569 |
0.01 | 80.1102 | 0.7989 |
0.05 | 86.265 | 0.7419 |
0.1 | 89.373 | 0.7161 |
0.2 | 92.3521 | 0.693 |
0.4 | 94.5417 | 0.67695 |
0.6 | 95.5224 | 0.67 |
0.8 | 95.861 | 0.667633 |
1. | 95.9952 | 0.6667 |
In[]:=
(*DataintheformofaPlots*)
In[]:=
ratioplot=Table[i,{i,0.001,1,0.001}];
In[]:=
ListPlot[Quiet[Transpose[{1/ratioplot,64/factor[ratioplot]}]],PlotRange->{{1.0,20},{78,98}},Frame->True,GridLines->Automatic,PlotStyle->Darker@Red,AspectRatio->1,Joined->True,FrameLabel->{Style["D/d",16],Style["A",16]}]
Out[]=
In[]:=
(*comparisonwithpreviouslypublishedplot*)
In[]:=
img=
;
In[]:=
ratioplot=Table[i,{i,1,10,0.5}];
In[]:=
p=ListPlot[Quiet[Transpose[{ratioplot,64/factor[1/ratioplot]}]],PlotRange->{{1.0,10},{88,98}},Frame->True,GridLines->Automatic,PlotStyle->Darker@Red,PlotMarkers->Automatic,AspectRatio->1,FrameLabel->{Style["D/d",16],Style["A",16]}];
In[]:=
Show[p,Prolog->{Raster[ImageData[img,DataReversed->True],{Scaled[{0.0,-0.02}],Scaled[{1,1}]}]}]
Out[]=