Counter-current gas permeation for H2S/CO2 separation from hydrocarbon mixture
Authors: Housam Binous and Ahmed Bellagi
Counter-current gas permeation for H2S/CO2 separation from hydrocarbon mixture
Authors: Housam Binous and Ahmed Bellagi
Authors: Housam Binous and Ahmed Bellagi
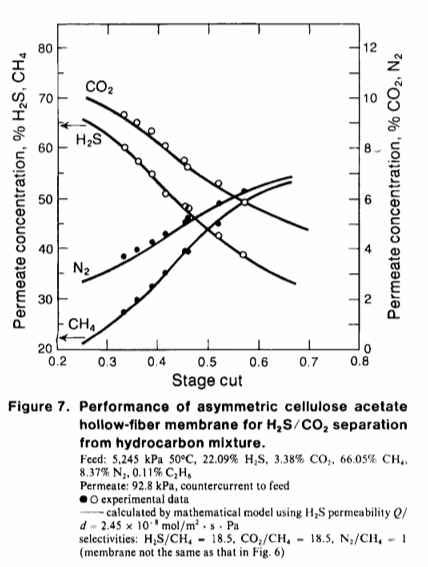
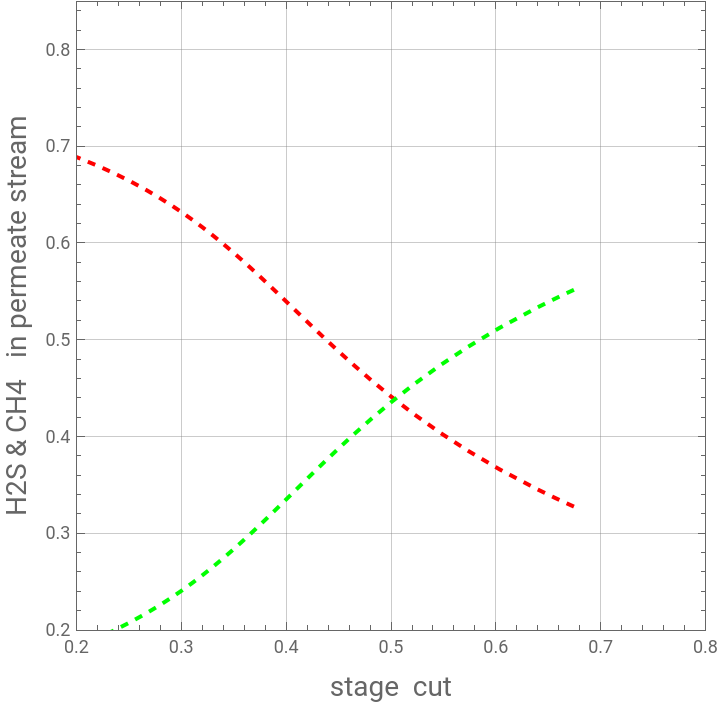
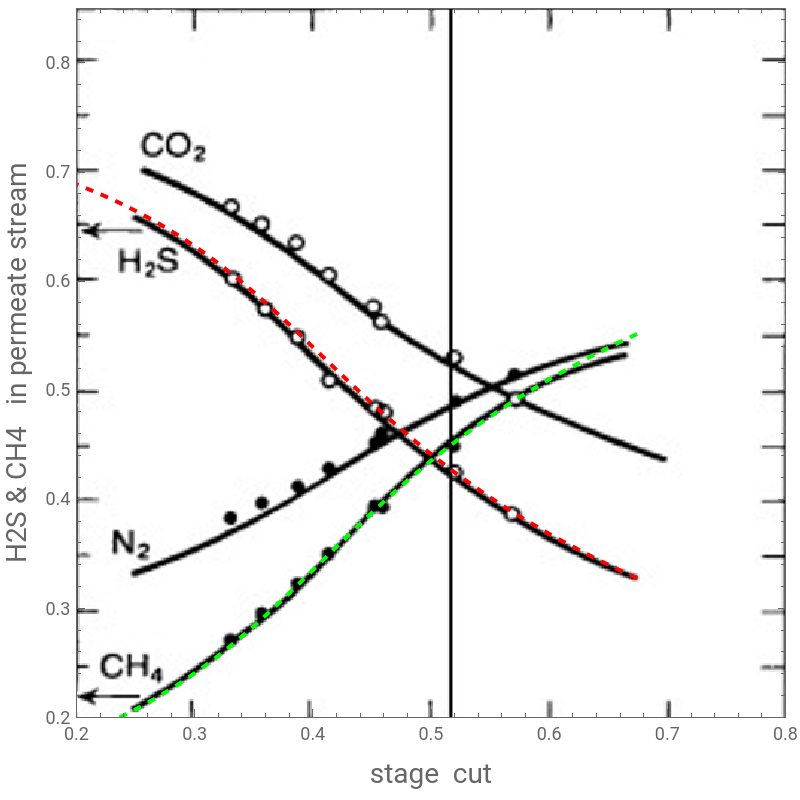
In Ref. 1, Pan studied the separation of acid gases (i.e., CO2 and H2S) using asymmetric cellulose acetate hollow-fiber membrane. Here, we successfully reproduce Fig. 7 of Ref. 1 using a counter-current gas permeation module and the methodology described in detail in Ref. 2.In this latter figure, Pan depicted the mole fractions of CH4, N2, H2S and CO2 in the permeate stream versus the stage cut.References:[1] Pan, C.Y. (1986), Gas separation by high-flux, asymmetric hollow-fiber membrane. AIChE J., 32: 2020-2027. https://doi.org/10.1002/aic.690321212[2] H . Binous, U . Zahid and A . Bellagi, Modeling for Multi - component Gas Permeation with Orthogonal Collocation and Arc - Length Continuation, Chemistry Africa (2024) . https://doi.org/10.1007/s42250-024-01167-y
In[]:=
Out[]=
{xA[1]0.040239,xB[1]0.00615698,xC[1]0.845103,xA[2]0.0407362,xB[2]0.00623307,xC[2]0.844595,xA[3]0.0422512,xB[3]0.00646488,xC[3]0.843047,xA[4]0.0448524,xB[4]0.00686288,xC[4]0.840389,xA[5]0.0486496,xB[5]0.0074439,xC[5]0.836509,xA[6]0.0537863,xB[6]0.00822987,xC[6]0.83126,xA[7]0.0604241,xB[7]0.00924551,xC[7]0.824478,xA[8]0.0687176,xB[8]0.0105145,xC[8]0.816003,xA[9]0.0787789,xB[9]0.012054,xC[9]0.805722,xA[10]0.0906329,xB[10]0.0138678,xC[10]0.79361,xA[11]0.104172,xB[11]0.0159394,xC[11]0.779775,xA[12]0.119123,xB[12]0.0182271,xC[12]0.764498,xA[13]0.135037,xB[13]0.0206621,xC[13]0.748236,xA[14]0.151316,xB[14]0.023153,xC[14]0.731602,xA[15]0.167264,xB[15]0.0255932,xC[15]0.715306,xA[16]0.18216,xB[16]0.0278724,xC[16]0.700085,xA[17]0.195325,xB[17]0.0298868,xC[17]0.686633,xA[18]0.206175,xB[18]0.0315469,xC[18]0.675546,xA[19]0.214249,xB[19]0.0327823,xC[19]0.667296,xA[20]0.219221,xB[20]0.0335432,xC[20]0.662215,yA[2]0.376024,yB[2]0.0575355,yC[2]0.501991,yA[3]0.380633,yB[3]0.0582408,yC[3]0.497282,yA[4]0.388261,yB[4]0.059408,yC[4]0.489487,yA[5]0.398811,yB[5]0.0610223,yC[5]0.478706,yA[6]0.412115,yB[6]0.0630579,yC[6]0.465113,yA[7]0.427907,yB[7]0.0654743,yC[7]0.448975,yA[8]0.44581,yB[8]0.0682136,yC[8]0.430682,yA[9]0.465323,yB[9]0.0711993,yC[9]0.410743,yA[10]0.485837,yB[10]0.0743382,yC[10]0.389781,yA[11]0.506675,yB[11]0.0775265,yC[11]0.368489,yA[12]0.527142,yB[12]0.0806583,yC[12]0.347575,yA[13]0.546595,yB[13]0.0836347,yC[13]0.327698,yA[14]0.564486,yB[14]0.0863722,yC[14]0.309417,yA[15]0.5804,yB[15]0.0888072,yC[15]0.293155,yA[16]0.594056,yB[16]0.0908967,yC[16]0.279202,yA[17]0.60529,yB[17]0.0926157,yC[17]0.267722,yA[18]0.61403,yB[18]0.0939531,yC[18]0.258791,yA[19]0.620259,yB[19]0.0949061,yC[19]0.252426,yA[20]0.623986,yB[20]0.0954764,yC[20]0.248618,yA[21]0.625226,yB[21]0.0956661,yC[21]0.247351,q[2]0.692196,q[3]0.695281,q[4]0.700456,q[5]0.707772,q[6]0.717302,q[7]0.729136,q[8]0.743369,q[9]0.760083,q[10]0.779305,q[11]0.800956,q[12]0.824798,q[13]0.850376,q[14]0.876987,q[15]0.903683,q[16]0.929319,q[17]0.952635,q[18]0.972374,q[19]0.987397,q[20]0.996799,theta0.308829,0.374483,0.0572997,0.503566,0.0646516}
y
PAi
y
PBi
y
PCi
y
PDi
In[]:=
In[]:=
SYS=Join[sys/.functions,{aux},init,initdev];SOL=Quiet@NDSolve[SYS,unknown1,{s,-10,10},AccuracyGoal7];
In[]:=
pA=ParametricPlot[{theta[s],yA[Np+1][s]}/.SOL[[1]],{s,-3.3875,4},PlotRange{{0.2,0.8},{0.2,0.85}},FrameTrue,GridLinesAutomatic,AspectRatio1,PlotStyle{Thick,Dashed,Red},FrameTrue,FrameLabel{Style["stage cut",14],Style["H2S & CH4 in permeate stream",14]}];pB=ParametricPlot[{theta[s],yB[Np+1][s]}/.SOL[[1]],{s,-3.3875,4},PlotRange{{0.2,0.8},{0,0.13}},FrameTrue,GridLinesAutomatic,AspectRatio1,PlotStyle{Thick,Dashed,Blue},FrameTrue,FrameLabel{Style["stage cut",14],Style["CO2 & N2 in permeate stream",14]}];pC=ParametricPlot[{theta[s],yC[Np+1][s]}/.SOL[[1]],{s,-3.3875,4},PlotRange{{0.2,0.8},{0.2,0.85}},FrameTrue,GridLinesAutomatic,AspectRatio1,PlotStyle{Thick,Dashed,Green},FrameTrue,FrameLabel{Style["stage cut",14],Style["H2S & CH4 in permeate stream",14]}];pD=ParametricPlot[{theta[s],1-yA[Np+1][s]-yB[Np+1][s]-yC[Np+1][s]}/.SOL[[1]],{s,-3.3875,4},PlotRange{{0.2,0.8},{0,0.13}},FrameTrue,GridLinesAutomatic,AspectRatio1,PlotStyle{Thick,Dashed,Magenta},FrameTrue,FrameLabel{Style["stage cut",14],Style["CO2 & N2 in permeate stream",14]}];P1=Show[pA,pC]P2=Show[pB,pD]
Out[]=
Out[]=
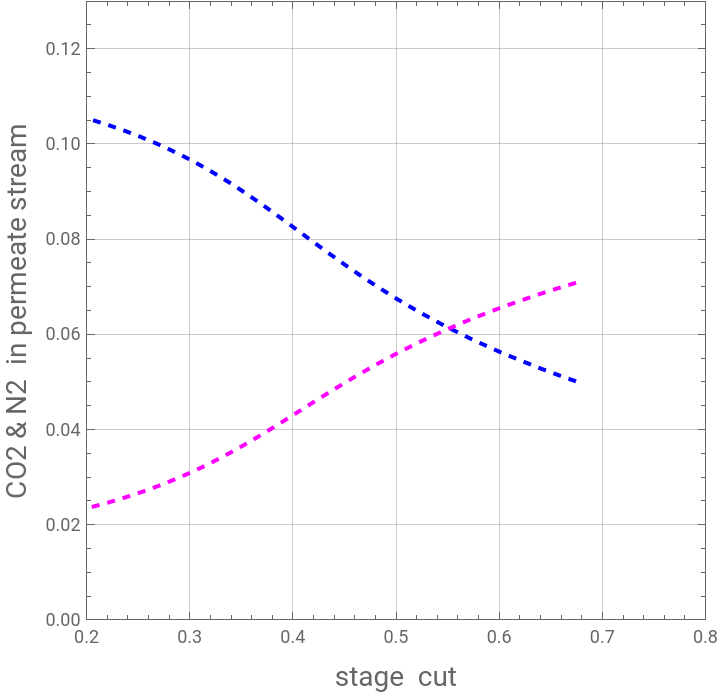
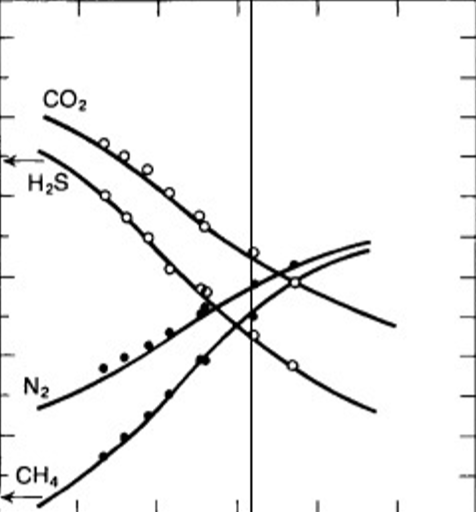
Comparison between our results (colored dashed curves) and Figure 7 of Ref. 1 indicates close agreement, which provides a validation of the methodology described in Ref. 2.
Comparison between our results (colored dashed curves) and Figure 7 of Ref. 1 indicates close agreement, which provides a validation of the methodology described in Ref. 2.
In[]:=
img=
;
In[]:=
Show[P1,ImageSize400{1,1},Prolog{Raster[ImageData[img,DataReversedTrue],{Scaled[{0.00,0.00}],Scaled[{1,1}]}]}]
Out[]=
Membrane area versus stage cut
Membrane area versus stage cut