In[]:=
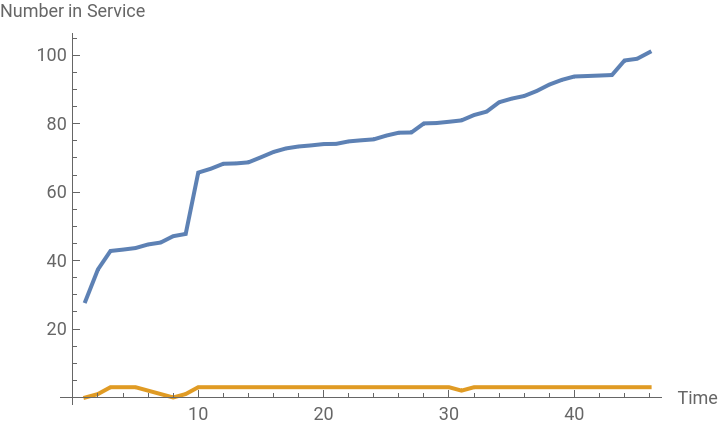
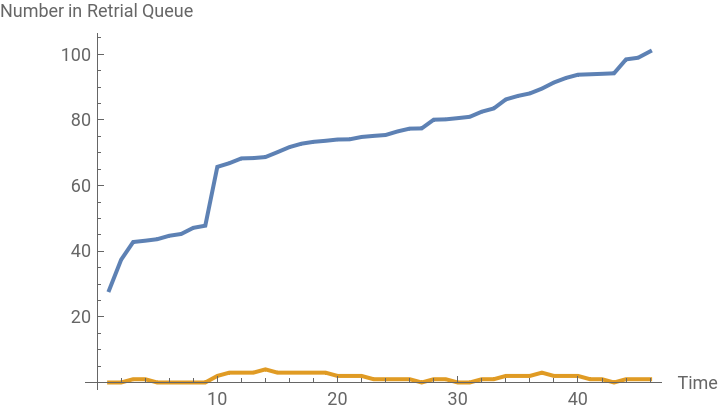
QueueSimulation[λ_,μ_,c_,θ_,maxCustomers_,maxTime_]:=Module[{state={0,0},time=0,events={},nextArrival,serviceTimes,nextRetrial=∞},(*Initializefirstarrivalandservicetimes*)nextArrival=RandomVariate[ExponentialDistribution[1/λ]];serviceTimes=ConstantArray[∞,c];(*Initially,allserversarefree*)While[Length[events]<maxCustomers&&time<maxTime,(*Findthenexteventtime*)time=Min[nextArrival,Min[serviceTimes],nextRetrial];(*Handlearrivalevent*)If[time==nextArrival,If[state[[1]]<c,(*Ifaserverisfree*)state[[1]]++;serviceTimes[[FirstPosition[serviceTimes,∞][[1]]]]=time+RandomVariate[ExponentialDistribution[1/μ]];,state[[2]]++;(*Else,addtoretrialqueue*)If[nextRetrial==∞,nextRetrial=time+RandomVariate[ExponentialDistribution[1/θ]];]];nextArrival=time+RandomVariate[ExponentialDistribution[1/λ]];,(*Handleservicecompletionevent*)If[time==Min[serviceTimes],state[[1]]--;serviceTimes[[FirstPosition[serviceTimes,time][[1]]]]=∞;If[state[[2]]>0,(*Handleretrialqueue*)state[[2]]--;state[[1]]++;serviceTimes[[FirstPosition[serviceTimes,∞][[1]]]]=time+RandomVariate[ExponentialDistribution[1/μ]];If[state[[2]]>0,nextRetrial=time+RandomVariate[ExponentialDistribution[1/θ]];,nextRetrial=∞;]],(*Handleretrialevent*)If[time==nextRetrial,If[state[[1]]<c,(*Ifaserverisfree*)state[[2]]--;state[[1]]++;serviceTimes[[FirstPosition[serviceTimes,∞][[1]]]]=time+RandomVariate[ExponentialDistribution[1/μ]];If[state[[2]]>0,nextRetrial=time+RandomVariate[ExponentialDistribution[1/θ]];,nextRetrial=∞;],nextRetrial=time+RandomVariate[ExponentialDistribution[1/θ]];]]];(*Recordthestate*)AppendTo[events,{time,state[[1]],state[[2]]}];]];events](*Parameters*)λ=5;(*Arrivalrate*)μ=7;(*Servicerateperserver*)c=3;(*Numberofservers*)θ=1;(*Retrialrate*)maxCustomers=1000;(*Numberofcustomerstosimulate*)maxTime=100;(*Maximumsimulationtime*)(*Simulatethequeue*)simResults=QueueSimulation[λ,μ,c,θ,maxCustomers,maxTime];(*Plotthenumberofcustomersinservice*)ListLinePlot[{simResults[[All,1]],simResults[[All,2]]},PlotLegends->{"Number of Customers in Service"},AxesLabel->{"Time","Number in Service"}](*Plotthenumberofcustomersintheretrialqueue*)ListLinePlot[{simResults[[All,1]],simResults[[All,3]]},PlotLegends->{"Number of Customers in Retrial Queue"},AxesLabel->{"Time","Number in Retrial Queue"}]
Out[]=

Out[]=
Explanation of the Code:
Initialization:
nextArrival initializes the time for the first customer arrival.
serviceTimes keeps track of when each server will finish its current service.
Event Loop:
The loop continues until the maximum number of customers (maxCustomers) or maximum time (maxTime) is reached.
It handles three events:
Arrival Event: A customer arrives. If a server is free, they are served; otherwise, they join the retrial queue.
Service Completion Event: A customer finishes service. If there are customers in the retrial queue, the next one retries for service.
Retrial Event: A customer in the retrial queue retries to get service.
Recording Events:
Each event is recorded in the events list, which tracks the time, the number of customers in service, and the number in the retrial queue.
Plotting Results:
Two plots are generated: one showing the number of customers in service over time and the other showing the number in the retrial queue.
This version should work correctly and allow you to simulate the behavior of an M/M/c retrial queue, providing insights into system performance.