Wolfram AgTech | Things to Try
Wolfram AgTech | Things to Try
Make edits and run any piece of code by clicking inside the code and pressing .
+
Access & Analyze Weather Data
Access & Analyze Weather Data
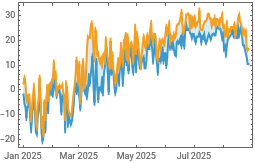
Retrieve temperature data for a provided location over a specified temporal range: |
In[]:=
min=WeatherData,"MinTemperature",,,"Day";max=WeatherData,"MaxTemperature",,,"Day";
Make a time series plot of the data: |
In[]:=
DateListPlot{min,max},Joined->True,Filling->{1->{2}},PlotLegends->SwatchLegend,,{"Min °C","Max °C"}
Out[]=
Make Maps and Access Remote Sensing Services
Make Maps and Access Remote Sensing Services
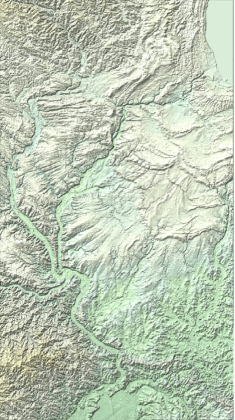
Plot a relief map of Illinois: |
In[]:=
GeoGraphics,GeoBackground->"ReliefMap",GeoZoomLevel->8
Out[]=
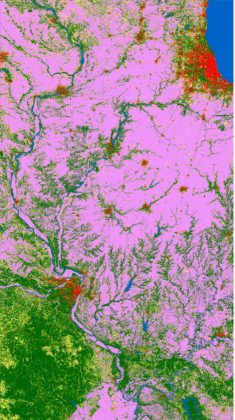
Map land cover using ESA data:
In[]:=
GeoGraphics,GeoServer->,GeoZoomLevel->8
Out[]=
Classify Soil Samples
Classify Soil Samples
Plot the standard USDA soil texture diagram: |
In[]:=
ResourceFunction["SoilTexturePlot"][]
Out[]=
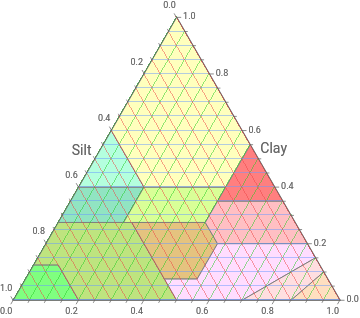
Visually classify soil sample provided as a list of relative quantities of sand, clay, and silt: |
In[]:=
ResourceFunction["SoilTexturePlot"][{(*Sand:*).3,(*Clay:*).3,(*Silt:*).4}]
Out[]=
