Approval voting election: analysis and visualization
St Louis 2021 Mayoral Election Ward Results
By Bob Sandheinrich
St Louis 2021 Mayoral Election Ward Results
By Bob Sandheinrich
Ward-by-Ward analysis of results form the 2021 St Louis, Missouri Mayoral Election. This election was notable in that it was one of the first US elections to use an approval voting primary. In the primary all candidates were listed without party and voters could approve as many or as few as they wanted with the top two candidates proceeding to the general election. In the general election, Tishaura Jones defeated Cara Spencer to become the next mayor of St. Louis. I am not a political scientist, I'm just a guy that can write some code and is not afraid to be wrong.
Primary
Primary
The primary election on March 2nd had four candidates.
Importing Data
Importing Data
Download the results from the Board of Elections:
primaryfile=URLDownload["https://www.stlouis-mo.gov/government/departments/board-election-commissioners/documents/election-results/upload/Mar21-Unofficial-Ward-by-Ward.pdf","stlmayor.pdf"]
Out[]=
File
Import the pages of the PDF as strings:
In[]:=
primarypages=Import["stlmayor.pdf","PagePlaintext"];
St. Louis currently has 28 wards. The results include one page for each ward:
Length[primarypages]
Out[]=
28
Each page looks something like this, including results for the mayoral race, comptroller and other races:
RandomChoice@primarypages
Out[]=
Election Summary ReportPrimary Municipal ElectionSt. Louis, MissouriMarch 2, 2021Summary For WARD 5, All Counters, All RacesFINAL UNOFFICIAL RESULTS BY APPROVAL PERCENTAGEDate:03/03/21Time:08:31:30Page:1 of 1Registered Voters 6131 - Cards Cast 994 16.21% Num. Report Precinct 8 - Num. Reporting 8 100.00%MAYORTotalNumber of Precincts 8Precincts Reporting 8 100.0 %Times Counted 994/6131 16.2 %Total Votes 1388 139.6 %LEWIS REED 454 45.67%CARA SPENCER 239 24.04%TISHAURA JONES 607 61.07%ANDREW JONES 88 8.85%COMPTROLLERTotalNumber of Precincts 8Precincts Reporting 8 100.0 %Times Counted 994/6131 16.2 %Total Votes 859 86.4 %DARLENE GREEN 859 86.42%ALDERMAN WD5TotalNumber of Precincts 8Precincts Reporting 8 100.0 %Times Counted 994/6131 16.2 %Total Votes 1025 103.1 %JAMES PAGE 404 40.64%TAMMIKA HUBBARD 621 62.47%
Define a function to extract mayoral votes counts from the text:
In[]:=
wardCounts[p_]:=Association@StringCases[p,{(cand:("LEWIS REED"|"CARA SPENCER"|"TISHAURA JONES"|"ANDREW JONES"|"Cards Cast"))~~" "~~n:Shortest[___]~~WhitespaceCharacter(cand->Interpreter["Integer"][n])}]
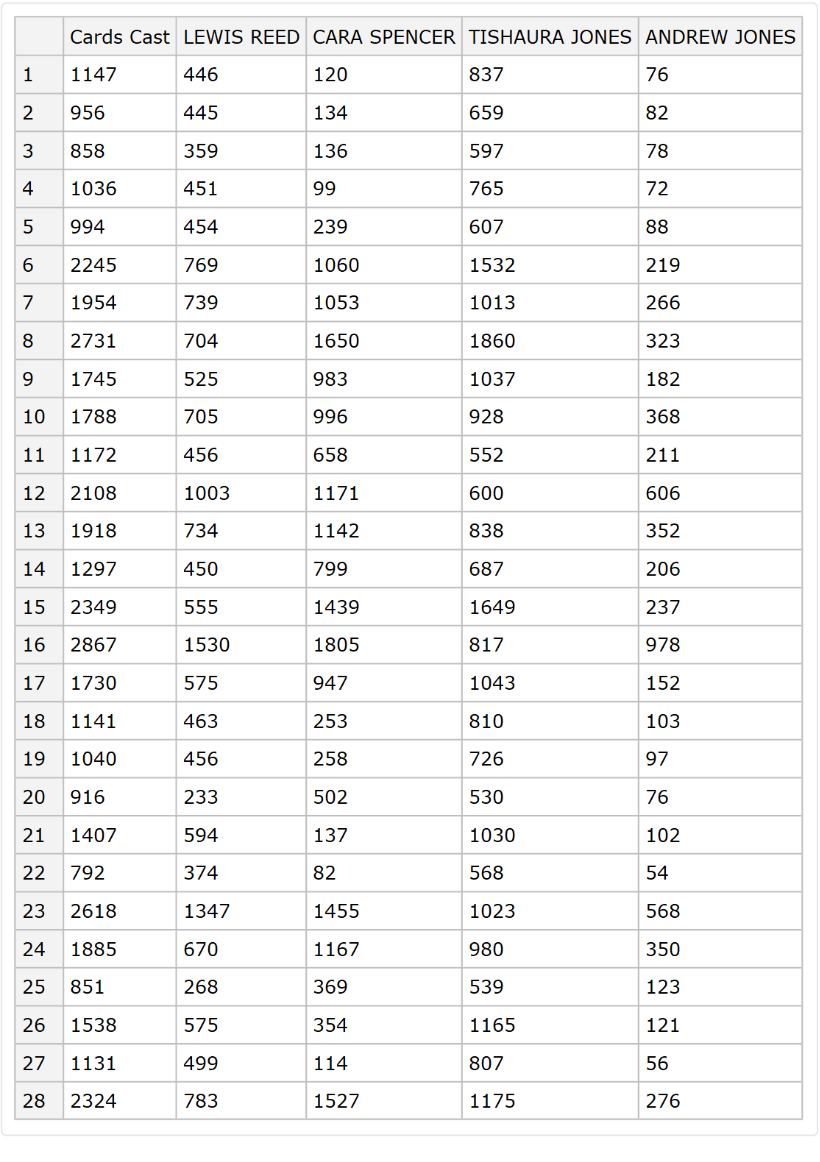
Create a Dataset from the primary results (The SetOptions below allows all 28 wards to display without scrolling):
SetOptions[Dataset,MaxItems40];primarywardvotes=Dataset[AssociationThread[(ToString/@Range[28])->wardCounts/@primarypages]]
Out[]=
Simple Tables
Simple Tables
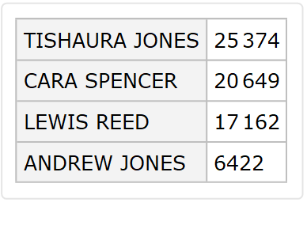
See which two candidates will advance (the city did this calculation without me):
Rest@ReverseSort@primarywardvotes[Total]
Out[]=
Add a column for votes per ballot:
primarywardvotes=primarywardvotes[All,<|#,"votes per ballot"N[(Total[#]-#["Cards Cast"])/#["Cards Cast"],3]|>&]
Differences
Differences
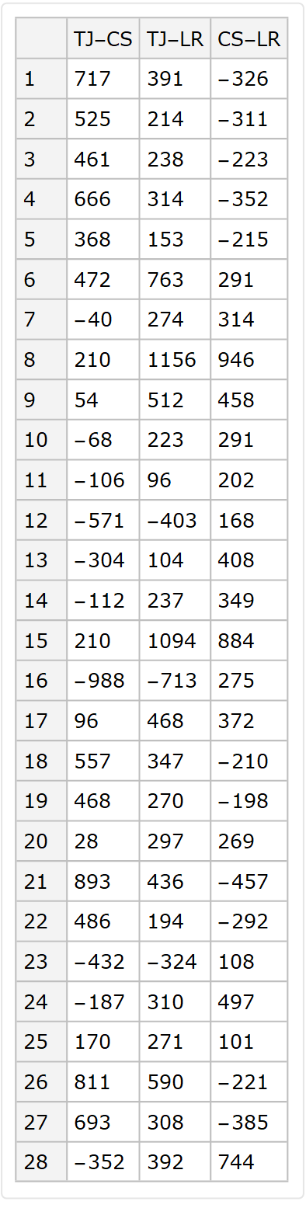
It's not clear what the best analysis is for approval voting. But it seems useful to look at the differences between candidates:
primarydiffs=primarywardvotes[All,<|"TJ-CS"#["TISHAURA JONES"]-#["CARA SPENCER"],"TJ-LR"->#["TISHAURA JONES"]-#["LEWIS REED"],"CS-LR"->#["CARA SPENCER"]-#["LEWIS REED"]|>&]
Out[]=
As percentages:
Style the dataset cells to show outliers:
Create a function to add background colors to the differences dataset:
Color the differences:
More Analysis
More Analysis
It was natural when the primary results in to use them to make predictions about the general election. Since Approval voting is new and rare, the best methods are not clear. A first step is to try to find voters that one voted for one for the candidates, since those might be secure votes in the general.
Jones-Spencer "secure" votes:
Jones-Spencer "secure" votes:
Overall Tishaura Jones had 4725 more approval votes than Cara Spencer:
Which is out of a total of 44538 primary voters:
But looking at each ward we can learn more.
See the wards with the largest difference between the winners. The 16th ward had many more votes for Spencer. But when we split the wards into large and small differences, Jones was favored in 11 out of 14 wards with large differences:
See the wards with the largest difference between the winners. The 16th ward had many more votes for Spencer. But when we split the wards into large and small differences, Jones was favored in 11 out of 14 wards with large differences:
We can see the total number of "secure" voters by totalling difference for each candidate in only the wards that they had more approvals.
Total all "secure" Jones votes:
Total all "secure" Spencer votes:
The total number of "secure" votes is only about a quarter of the voters. For three quarters of voters we can not know from this data if they voted for only one of the advancing candidates:
Voters to target
Voters to target
Where are voters most likely to be undecided. There seem to be two places. First, places where there were probably a lot of voters who approved both Tishaura Jones and Cara Spencer. And second, places where there were probably a lot of voters that only selected eliminated candidates.
Find the wards where both advancing candidates had the most votes. These are likely battlegrounds for the general election:
Find the wards where eliminated candidates had the most votes compared to the advancing candidates. These wards are likely to have up-for-grabs voters. The advancing candidate that did better in each ward should be expected to gain more of the up-for-grabs votes and should treat these wards as opportunities.
Within most of these wards, Spencer outperformed Jones:
Within most of these wards, Spencer outperformed Jones:
Maps
Maps
People love maps. They have colors on them.
Import Data from the city government (thanks St. Louis!)
Import Data from the city government (thanks St. Louis!)
Download and unpack a zip:
Find and import the Shapefile:
Get the polygons:
There are 28, just like the number of wards. That was much easier than I expected:
Create Maps
Create Maps
Jones-Spencer difference
map
Create a map with a legend:
Approval Rate
This is interesting. It looks like every other map of St. Louis, but why? Candidate appeal? Ward Organization communication? Campaign messaging?
Turnout
Turnout
Compute turnout by ward for the primary:
General
General
General election results from April 6th
Importing Data
Importing Data
Download the PDF from the city:
Two per ward:
Look at a pair of consecutive pages. It is clear that they go together:
Combine pages for each ward:
Create a Dataset from the results:
Simple Tables
Simple Tables
See which two the next mayor is (the city did this calculation without me):
Differences
Differences
Compute the differences as votes and as a percent:
Style the dataset cells to show outliers:
Create a function to add background colors to the differences dataset:
Color the differences:
Maps
Maps
People love maps. They have colors on them.
Jones-Spencer difference
Jones-Spencer difference
Calculate the differences in a good format for mapping:
Rescale the data so that zero is at 0.5:
Create a map with data:
As a percent:
Turnout
Turnout
Calculate general election turnout:
General vs Primary
General vs Primary
Data tables
Data tables
See the margin in the general (left) vs the primary:
See the change in the margin from the primary to the general in Jones's favor:
See the change in margin as a percentage:
Maps
Maps
Turnout
Turnout
Turnout increased in every ward in the general election:
Margin Change
Margin Change
Despite losing the election, Spencer actually managed to decrease the margin between her total and Jones's total compared the primary.
See how the margin between Jones and Spencer changed between the primary and general in each ward:
As a percent:
Targets
Targets
"Opportunities"
"Opportunities"
How did the candidates capitalize on the opportunities defined from the primary data? These are the primary margins in those wards where the eliminated candidates did best:
We expect to see the increase from the primary to the general match those directions and they do. Each opportunity ward moved in the expected direction. Spencer gained thousands of marginal votes relative to the primary in wards 12, 16 and 23:
They are very strongly correlated:
Overall Spencer gained 4391 marginal votes in these wards:
That is almost twice what she gained overall. She must have lost marginal votes somewhere else.
Battlegrounds
Battlegrounds
What happened in the other battleground wards we identified from suspecting a lot of voters voted for both candidates in the primary? Neither candidate consistently won the battlegrounds:
Overall, Spencer gained 200 marginal votes in these wards:
So what gives? Let's look at the rest of the wards:
AHA! In the wards that we didn't identify as targets, Jones gained 2156 marginal votes. That is very close to the overall margin of the election:
In fact these other wards had larger swings that the identified battlegrounds:
Conclusions
Conclusions
Moving from the primary to the general election, Cara Spencer was able to gain ground by dramatically increasing her vote margin in the wards where eliminated candidates did best (12, 16. 23). This was predicted from the primary data in the "opportunities" calculation.
However, the method used to pick "battlegrounds" failed miserably. Battleground wards that were not also "opportunities" were no more significant than other wards.
However, the method used to pick "battlegrounds" failed miserably. Battleground wards that were not also "opportunities" were no more significant than other wards.
Keywords
Keywords
◼
Elections
◼
Politics
◼
Approval Voting
◼
Maps
◼
PDF import
◼
Shapefile
◼
St. Louis
◼
Mayor