Overview
Overview
This notebook shows how to monitor the market in real time using a Mathematica notebook and the Schwab API. The supplemental package script has been significantly upgraded, this time by me, not an AI. The other purpose making these posts is to keep a journal of how the building of the API is progressing. In the next session I will fill in the gaps.
Developer journal
Developer journal
First a little background. I am 80 years old and have been using Mathematica for 37 years, mainly for entertainment as a hobby. I stopped fooling around with low level languages in 1998, and I have never programmed a line of Python code. I have some experience writing Packages; I wrote the first package for stable distributions, which was published in Mathematica Journal in 2005.
After I established an account for the Schwab developer API, the first problem was to use Mathematica code to get the tokens to make URL requests, which is now done with the appAuthorization[] function. I would not have been able to do this without Python code from this website by Carsten Savage. The first code block on his site shows how to complete the authorization and get the tokens. Notebook Assistant was useless in trying to get it to work, but XAI’s Grok was eventually useful, but it took several hours of Grok generating code and my testing it then reporting errors before we worked it out. Grok appears to have understanding of the Schwab API from code it has retained from GitHub and Reddit. The original code is in my first post; the code is frankly a mess, but I only wrote about six lines of it. My strategy has been to use it as long as it works, then fixing it when there is a problem. Since I am starting with just data access, AI code cannot do any damage, bad code simply does not get the data and returns error information. Grok seemed to develop the code translated from Python, the same way I would develop it. First it generated lines of code to paste into a notebook; after the function was working with no errors use it to create a working function as a Module.
Last night during a thunder storm I lost internet while my laptop was running a refreshTokens[]. The AI’s error checking was a disaster; I lost all my stored tokens and had to reauthorize the interface. I rewrote most of the error code myself and that is now in the attachment. I also made the HTTPRequest[]s more consistent across the functions.
If there is any interest in this application, the long term goal will be to see if Notebook Assistant can create package documentation from the code and these post examples.
Notebook code
Notebook code
The functioning notebook is in the cells below. Code segments are labeled and can be opened to read the full code. I have not included any significant documentation in the code segments but will be happy to answer any questions, if you reply to this post.
Intraday Volatility Monitor
Intraday Volatility Monitor
In[]:=
Needs["SchwabAPI`"]
In[]:=
$SchwabAPIVersionAbsoluteTime[]-apiTokenTime
Out[]=
4 May 2025
Out[]=
2259.3220458
In[]:=
PingTime["api.schwabapi.com"]URLResponseTime["https://api.schwabapi.com"]nbStart=SessionTime[];
Out[]=
Out[]=
In[]:=
(*refreshtokensifexpired*)If[AbsoluteTime[]-apiTokenTime>1790,apiTokens=Import[tokenFile,"RawJSON"];apiTokens=refreshTokens[apiTokens["refresh_token"],appKey,appSecret];apiTokenTime=AbsoluteTime[];]
In[]:=
SessionTime[]-nbStart(*timetorefreshtokens*)
Out[]=
0.6028517
Code
In[]:=
startDate=Today;While[!BusinessDayQ[startDate,HolidayCalendar{"UnitedStates","NYSE"}],startDate=PreviousDate[startDate,"Day"]];
In[]:=
prices=getPriceHistory["SPY",apiTokens["access_token"],startDate,NextDate[startDate,"Day"],needExtendedHoursDataTrue];If[prices===$Failed,Abort[]]
In[]:=
minDS=Dataset[prices["candles"]]/.bigint_Integer:>If[bigint>10^12,FromUnixTime[bigint/1000,TimeZone->"America/New_York"],bigint]
Out[]=


In[]:=
spyToday=Values[Normal[minDS[All,{"datetime","open","high","low","close","volume"}]]];
In[]:=
$TimeZone="America/New_York";gClose=DateListLogPlot[{spyToday[[All,{1,3}]],spyToday[[All,{1,4}]],Tooltip[#,#]&/@spyToday[[All,{1,5}]]},Filling{1{2}},(*FillingStyleDirective[Thick,Darker[Blue]],*)PlotStyle{PointSize[0],PointSize[0],Darker[Red]},Joined{True,True,False},InterpolationOrder->0,PlotRangeAll,GridLinesAutomatic,PlotLabel"SPY Minute Close "<>DateString[spyToday[[-1]][[1]],"DateShort"]];
In[]:=
volumeData=Select[spyToday[[All,{1,6}]],#[[2]]>0&];gVolume=DateListPlot[Tooltip[#,#]&/@volumeData,Joined->False,PlotRangeAll,FillingAxis,GridLinesAutomatic,PlotLabel"SPY Volume"];
In[]:=
lnhilo={#1,Log[#3/#4]}&@@@Select[spyToday,#[[3]]>0&];
In[]:=
median=Median[lnhilo[[All,2]]]max=Max[lnhilo[[All,2]]]//N
Out[]=
0.000200053
Out[]=
0.00357083
In[]:=
gVolatility=DateListPlot[Tooltip[#,#]&/@lnhilo,JoinedFalse,FillingAxis,PlotRangeAll,GridLines{Automatic,{Sequence@@Table[i,{i,0,Ceiling[max,0.0005],0.0005}],{median,Directive[Darker[Red],Thick]}}},PlotLabel"SPY Volatility"];$TimeZone=$SystemTimeZone;
In[]:=
SessionTime[]-nbStart
Out[]=
1.1924853
In[]:=
gClose
Out[]=
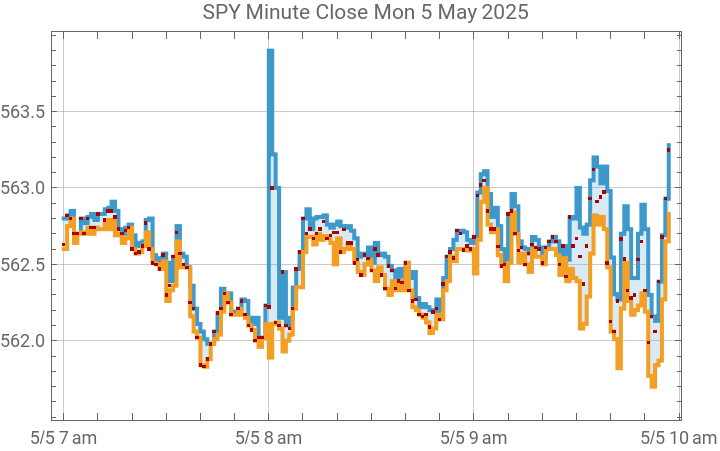
In[]:=
gVolatility
Out[]=
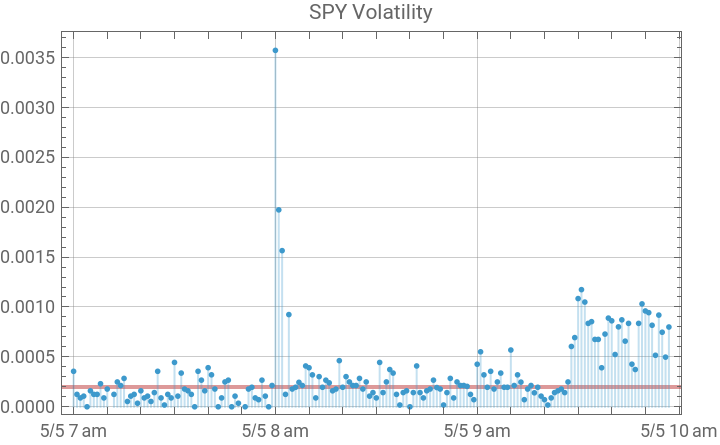
In[]:=
gVolume
Out[]=
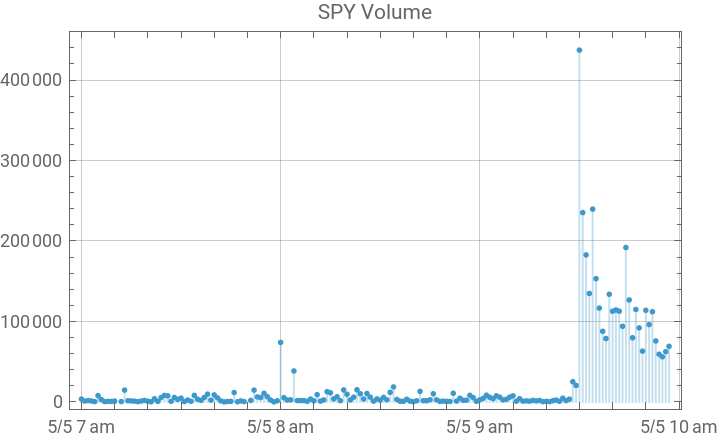
In[]:=
SessionTime[]-nbStart
Out[]=
1.9785312
Code
In[]:=
Clear[FractalDC];FractalDC[data_]:=Module{d,i=1,positions,len,d0,d1,d2,d3},(*thisstructurewithStuffBag[]isfasterthanAppendTo[]*)positions=Internal`Bag[];len=Length[data];(*thelastcolumnofdataisassumedtocontaintheinformationwiththetrend*)d=If[Length[Dimensions[data]]>1,data[[All,-1]],data];Whilei≤len-3,{d0,d1,d2,d3}=Take[d,{i,i+3}];Internal`StuffBag[positions,i];i=
;;(*addlatestpoint*)Internal`StuffBag[positions,i];(*checkd2*)If[ilen-2&&(d2>d0&&d2>d1&&d2≥d3)||(d2<d0&&d2<d1&&d2≤d3),Internal`StuffBag[positions,i+1]];(*don'tloselastdatapoint*)If[Internal`BagPart[positions,-1]<len,Internal`StuffBag[positions,len]];data[[Internal`BagPart[positions,All]]];
|
Code
CITE THIS NOTEBOOK
CITE THIS NOTEBOOK
Real time market monitor with notebook using Schwab API
by Robert Rimmer
Wolfram Community, STAFF PICKS, May 5, 2025
https://community.wolfram.com/groups/-/m/t/3455097
by Robert Rimmer
Wolfram Community, STAFF PICKS, May 5, 2025
https://community.wolfram.com/groups/-/m/t/3455097