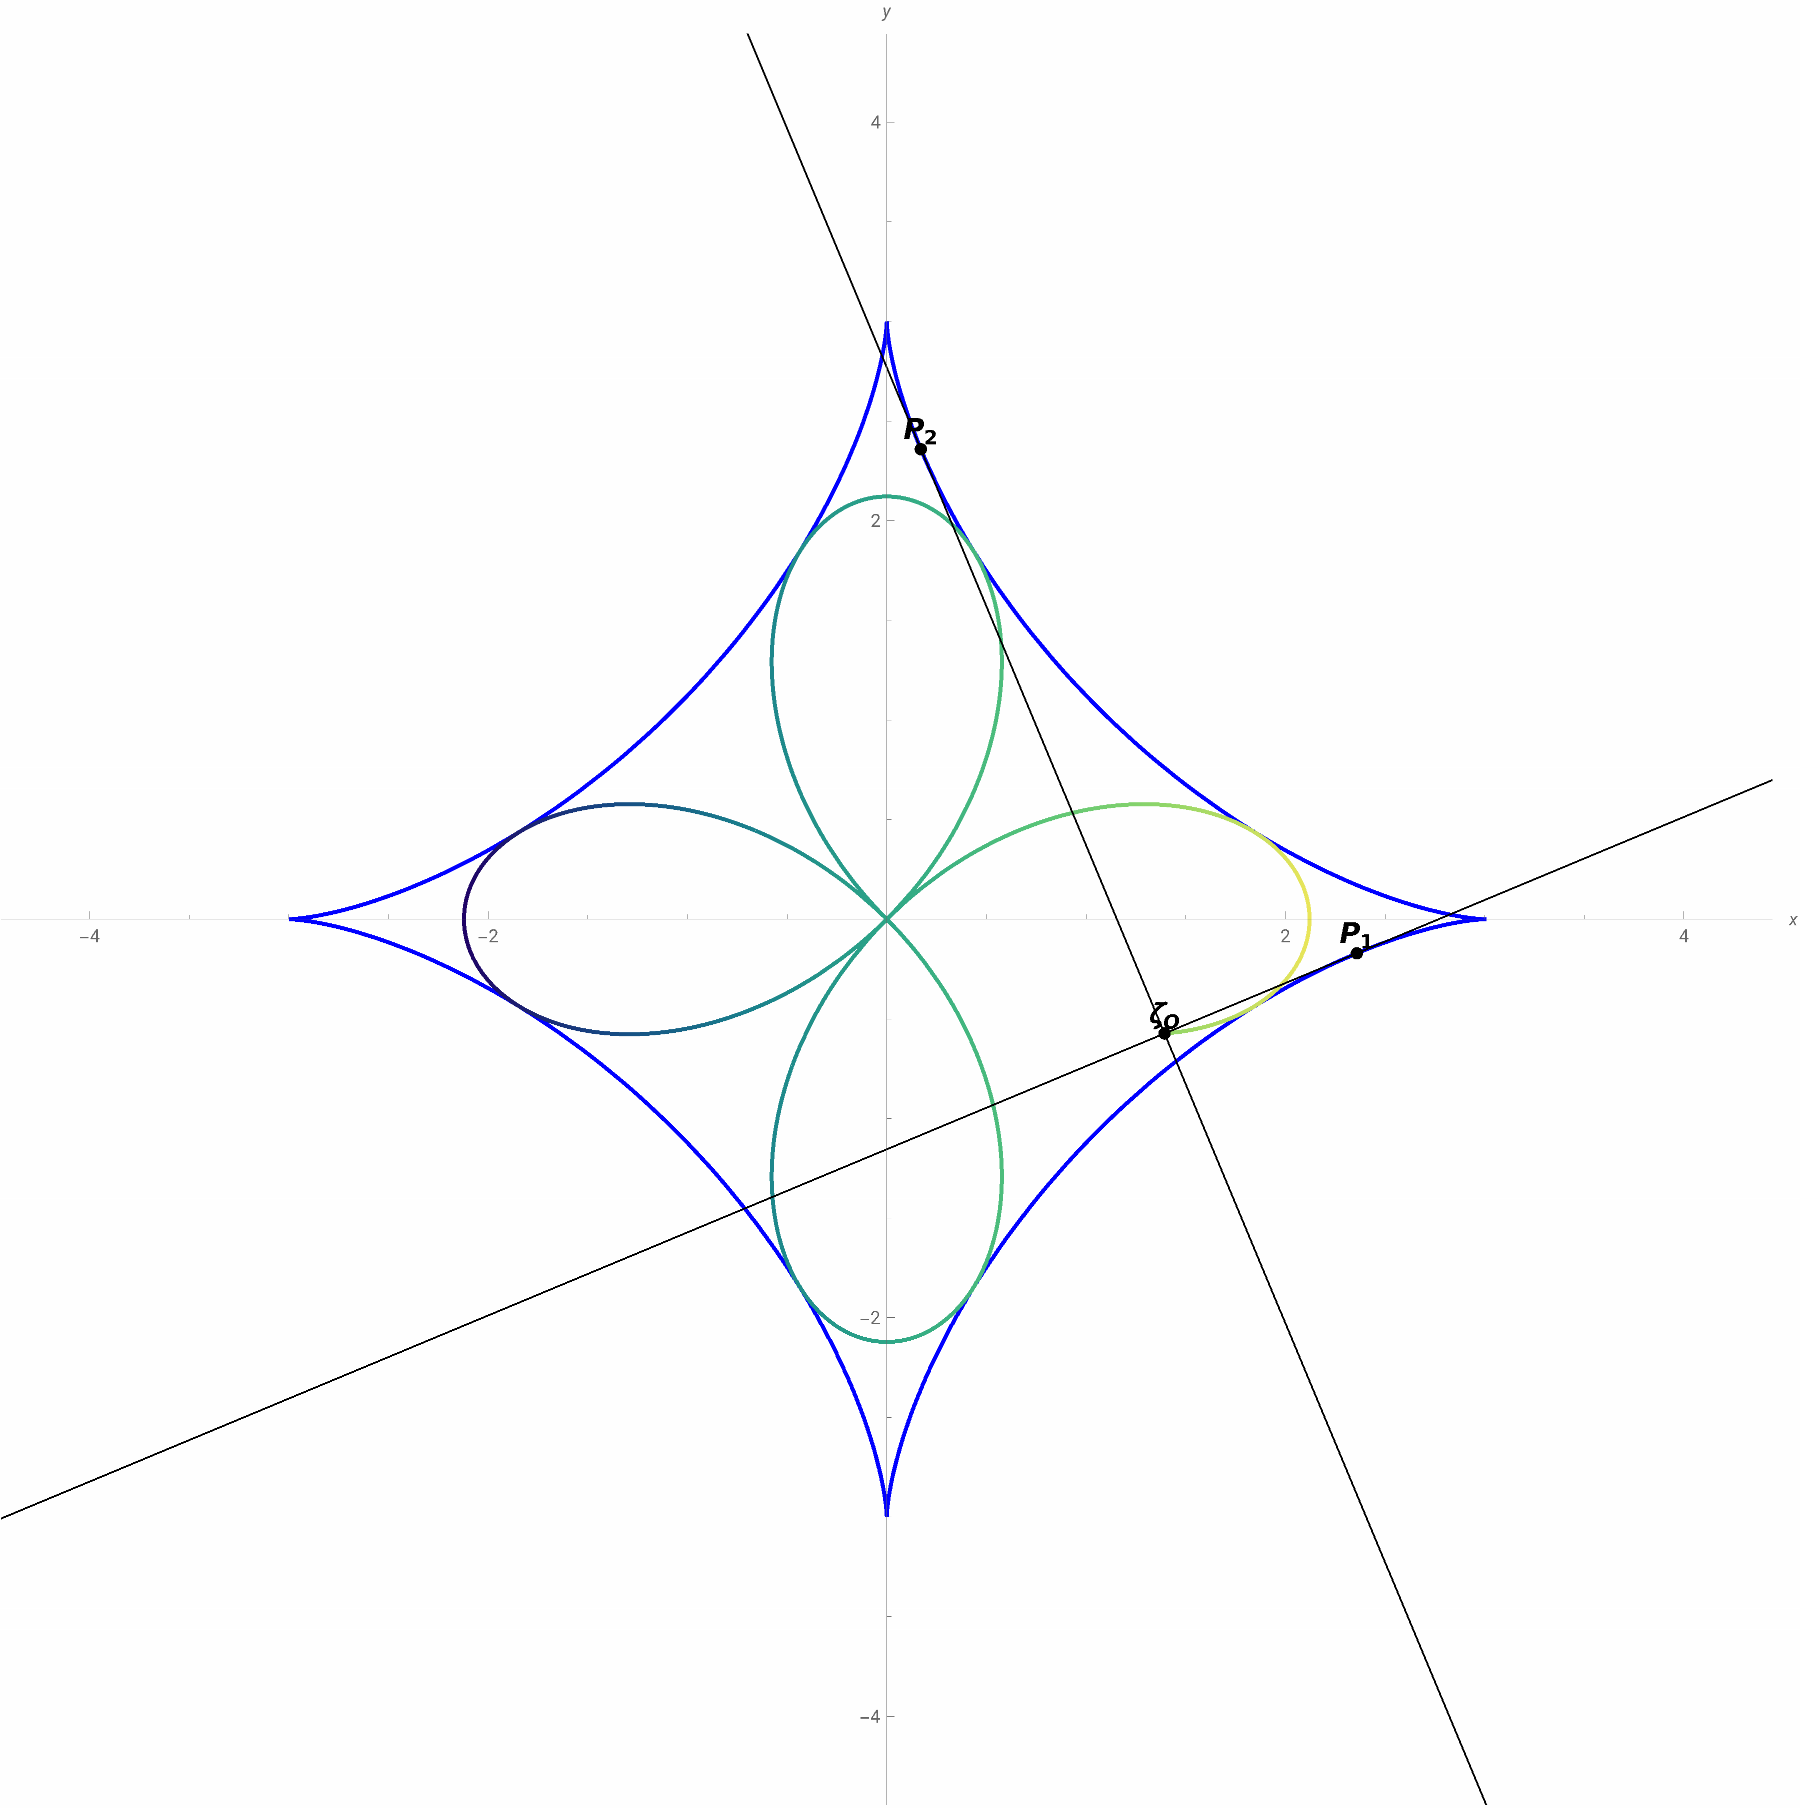
OrthopticCurveAstroid::usage="It is the geometric locus of the intersection point of two tangent lines to a curve and orthogonal to each other. References: mathecurve.com: Orthoptic curve; Personal.";
Development:
Obtaining the parametric equations from the orthoptic curve to the astroid:
In[]:=
ζ[t_]:={a,a};x[t_]:=a;y[t_]:=a;//FullSimplify
3
Cos[t]
3
Sin[t]
3
Cos[t]
3
Sin[t]
y'[t]
x'[t]
-Tan[t];
In[]:=
m[t_]:=-Tan[t];
Perpendicularity condition (be two points of the astroid and):
t
1
t
2
Tan[]Tan[]==-1;
t
1
t
2
This condition is only met if the difference of the angles is :
π
2
t
2
t
1
π
2
t
2
t
1
π
2
In[]:=
Solvey-y[t]==m[t](x-x[t]),y-yt+==mt+x-xt+,{x,y}//FullSimplify
π
2
π
2
π
2
{{xaCos[t]Sin[t](-Cos[t]+Sin[t]),yaCos[t]Sin[t](Cos[t]+Sin[t])}};
[t_]:={aCos[t]Sin[t](-Cos[t]+Sin[t]),aCos[t]Sin[t](Cos[t]+Sin[t])};
ζ
O
Animation:
In[]:=
Manipulatea=3;ζ[t_]:={a,a};[t_]:={aCos[t]Sin[t](-Cos[t]+Sin[t]),aCos[t]Sin[t](Cos[t]+Sin[t])};ShowParametricPlot[ζ[θ],{θ,0,2π},PlotStyle{Blue,Thick}],ParametricPlot[[t],{t,0,t1},ColorFunction->"BlueGreenYellow"],GraphicsBlack,PointSize[0.007],Point[ζ[t1]],Text[Style["",14,Bold],ζ[t1],{0,-1.2}],Pointζt1+,TextStyle["",14,Bold],ζt1+,{0,-1.2},Point[[t1]],Text[Style["",14,Bold],[t1],{0,-1.2}],InfiniteLine[{ζ[t1],[t1]}],InfiniteLineζt1+,[t1],AspectRatioAutomatic,AxesTrue,AxesOrigin{0,0},AxesLabel{x,y},PlotRange4,ImageSize900,Style["Orthoptic curve of an astroid",Bold,Large],{{t1,0.00002,"Value (t1)"},0.00001,2π,0.00001},ControlPlacementTop
3
Cos[t]
3
Sin[t]
ζ
O
ζ
O
P
1
π
2
P
2
π
2
ζ
O
ζ
O
ζ
O
ζ
O
π
2
ζ
O
Out[]=