Summary
Summary
1) Brief introduction to map making.
2) Description and handling of data.
3) Examples of geo computation.
4) Examples of geo visualization.
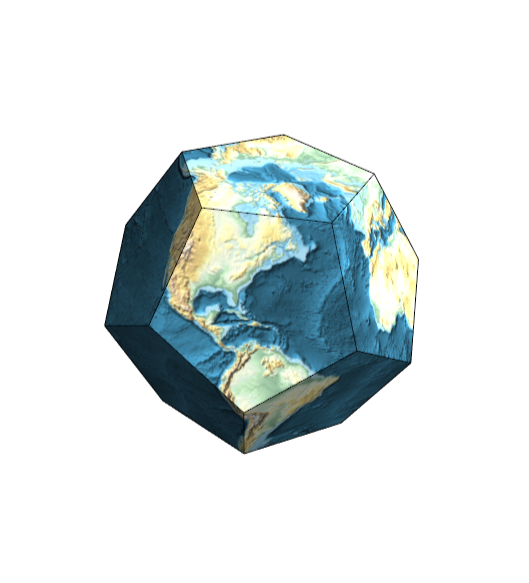
Brief Intro to Map Making
Brief Intro to Map Making
Maps of Regions
Maps of Regions
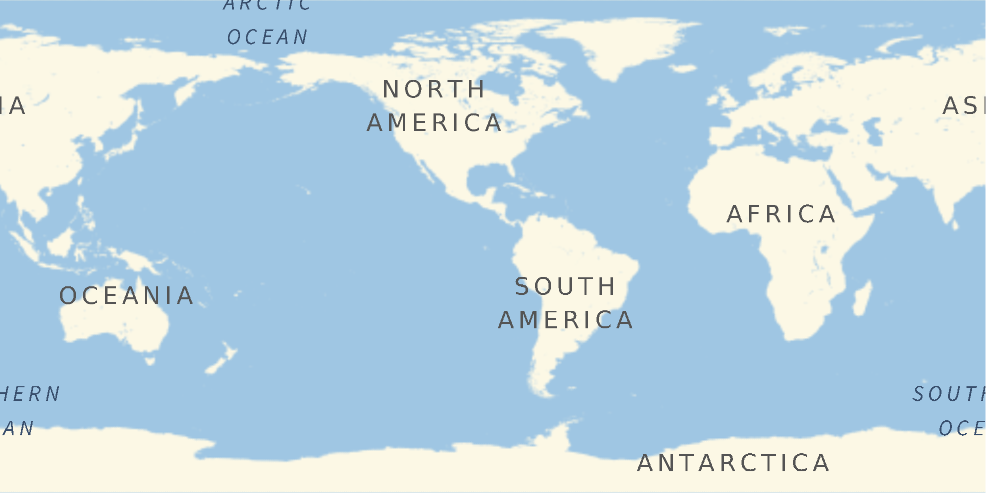
• Create a map of any region with , by default a map of the world centered at your location:
GeoGraphics[]
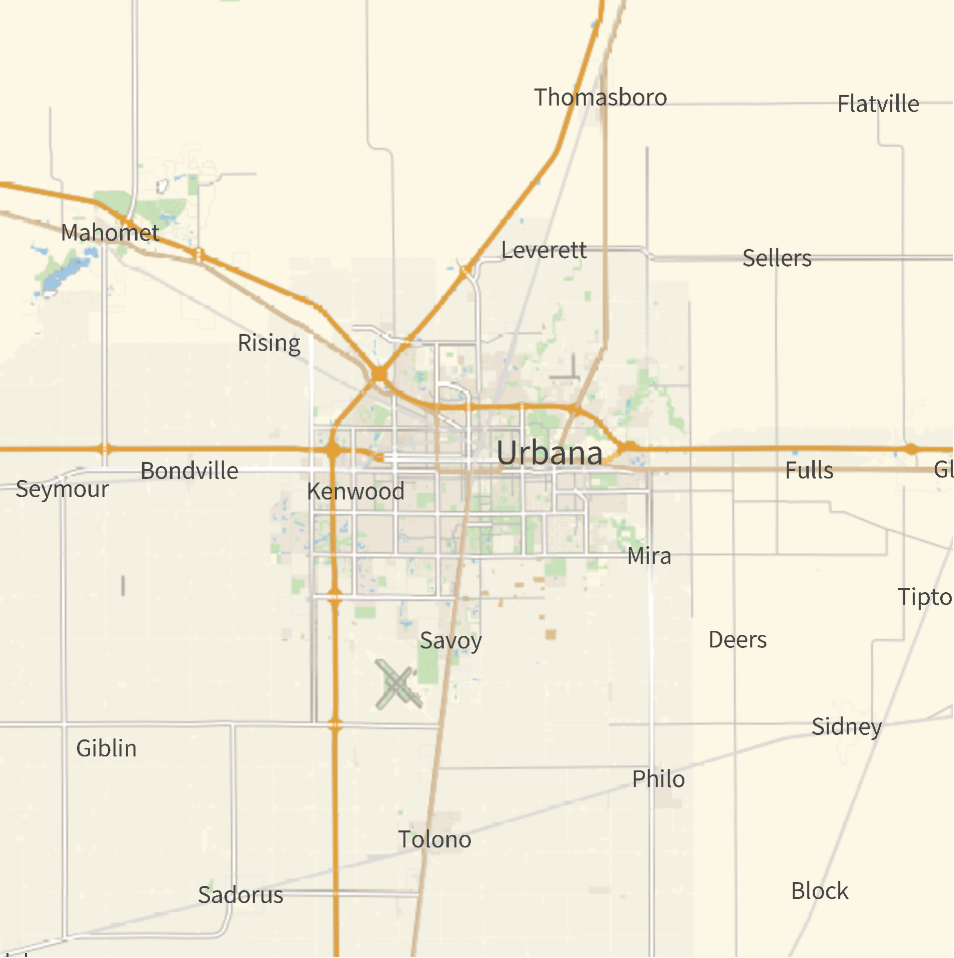
• A map of your local area:
GeoGraphics[Here]
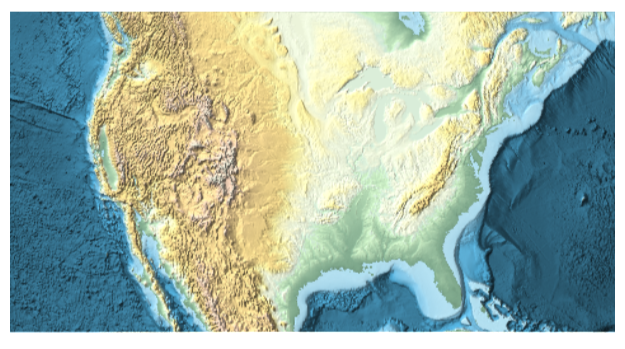
• Specify any region using geographic entities. Modify the default choices using options:
GeoGraphics,GeoBackground"ReliefMap",ImageSizeLarge
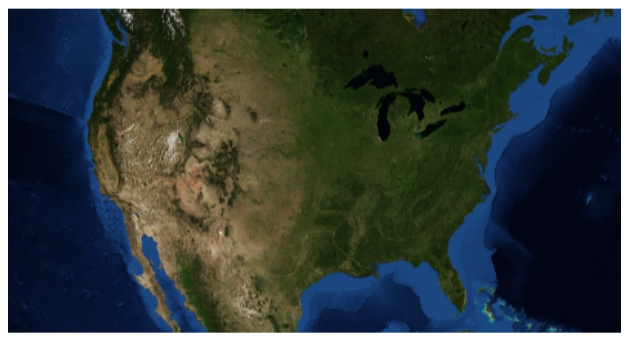
GeoGraphics,GeoBackground"Satellite",ImageSizeLarge
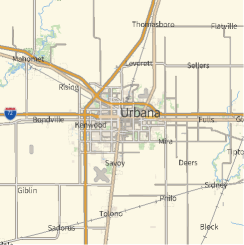
• Soon GeoGraphics will produce vector maps (as opposed to raster maps) by default:
GeoGraphics[Here,GeoBackground->"VectorClassic"]
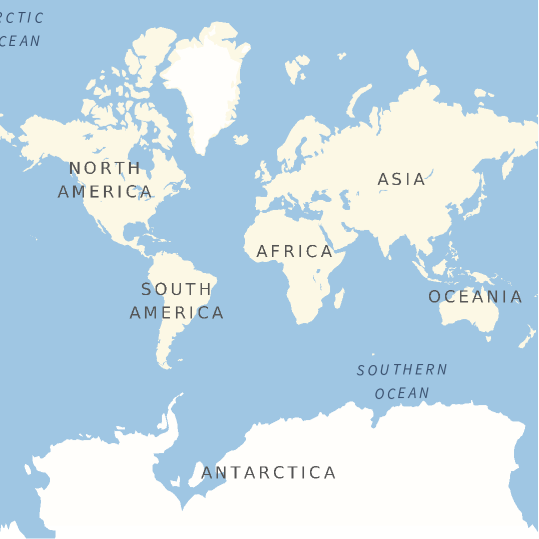
GeoGraphics["World",GeoBackground->"VectorClassic"]
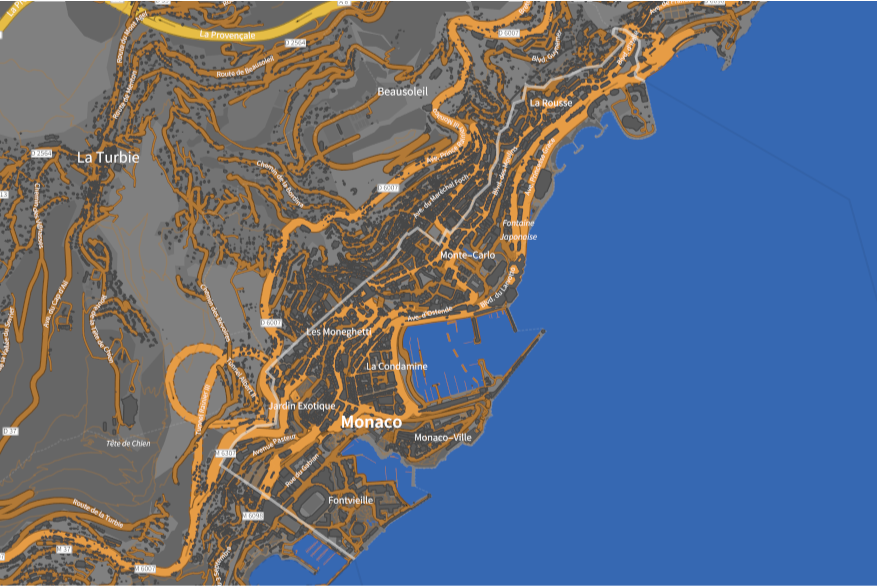
GeoGraphics,GeoBackground->"VectorMarketing",ImageSize->{1200,800}
Primitives and Projections
Primitives and Projections
• Draw geo primitives on the map, following the paradigm of Graphics:
• Draw the same map in the Mercator projection:
Satellite Images
Satellite Images
• Satellite imagery can be used as background in any other map:
Dynamic Maps
Dynamic Maps
• Zooms and resolution at the equator for the Earth in raster maps:
Intro to Data Handling
Intro to Data Handling
Quantities and Their Units
Quantities and Their Units
• Wind speed around the current location:
• Change units:
• The default unit system (“Metric” or “Imperial”) is decided by your current location:
• Other examples:
Dates
Dates
• The current instant and day:
• Control time zone, calendar, time system and granularity:
Change to many other calendars for your favorite day:
• Compute the variability of the duration of a day as a difference in milliseconds with respect to 86400 SI seconds:
Entities
Entities
• Geographical entities: countries, cities, mountains, zip codes, parks, buildings, ... For example:
• Get property values:
• Entity classes, representing a list of entities:
Locations of the World
Locations of the World
• They can also contain elevation (in meters) and even a time stamp (in seconds since the beginning of 1900):
• With elevation information you can draw the region of visibility from that point:
• All geo entities have “Position” values:
• Some of them also have “Polygon” values.
• Collections of locations:
GeoPosition[{{-27.10598566841147, -62.05846674265503}, {-24.775852594406523,
-61.18497963874953}, {-31.83696507409413, -60.33683732840358},
{-26.24398434401783, -54.555453505527694}, {-48.51124930639136,
-72.23453992605835}}]
-61.18497963874953}, {-31.83696507409413, -60.33683732840358},
{-26.24398434401783, -54.555453505527694}, {-48.51124930639136,
-72.23453992605835}}]
Geo Computation
Geo Computation
Distances, Directions and Areas
Distances, Directions and Areas
• Choose some location in the world, say the Eiffel Tower:
Draw the geodesic (shortest path) from your location to that other location:
• Distance between both locations:
• Initial angle with respect to geographic North, measured clockwise:
• Inverse problem: given distance and direction, what is the final destination from a given location?
• The Earth is not spherical: its polar radius is about 21 km shorter than its equatorial radius, about 1/300:
• Question: Where do you end up if you move 40000km along a geodesic?
• Areas:
Include all areas:
Compute Travel Directions
Compute Travel Directions
• Compute information about trips (by road, cycling or walking) between any two places
• Get basic information about the trip:
• Get detailed information about the trip:
Large Variety of Projections
Large Variety of Projections
• Differences among projections are clearer when comparing maps of the whole world:
• There are currently 154 projections supported for spherical models of the Earth, with 10% of those currently also supported on ellipsoidal models of the Earth.
Then there are 376 local coordinate systems, used in parts of the world (like the SPCS projections for the US states, or the UTM projections for a subdivision of the world in sixty 6-degree slices).
• Examples:
• A collage of projections, always showing meridians in blue and parallels in red:
Geo Visualization
Geo Visualization
GeoRegionValuePlot: Population Maps
GeoRegionValuePlot: Population Maps
• Color different regions by their population:
GeoDensityPlot/GeoContourPlot: Continuous Fields
GeoDensityPlot/GeoContourPlot: Continuous Fields
• Take a GeoPosition list and a corresponding list of values:
• Represent the data as a density plot:
• Show contours of the same data:
• Show both together:
GeoVectorPlot/GeoStreamPlot: Vector Fields
GeoVectorPlot/GeoStreamPlot: Vector Fields
• Compute the magnetic vector field in your vicinity:
• Evolution of the magnetic poles from 1657 to today:
• Compute the magnetic field around the North Pole:
• The magnetic field does not always point towards the geographical North Pole:
GeoHistogram
GeoHistogram
• Show the distribution of breweries in the US:
• Show a smooth kernel histogram of the same data:
GeoGraphPlot: Connectivity
GeoGraphPlot: Connectivity
It has the usual graph and geographic styling capabilities:
Geodesic paths will be used if a drivable route can’t be found:
Choice of Color Function: The Surface of the Moon
Choice of Color Function: The Surface of the Moon
• The visible and hidden faces of the Moon look quite different, with the hidden face showing many more craters:
3D Representations
3D Representations
Community examples
Community examples
Conclusions
Conclusions
• In this talk you have learnt some of the basic elements needed to describe data about our world: Quantity, DateObject, Entity or GeoPosition.
• A number of examples about geo computation were shown, involving distances, directions, areas, travel directions and map projections, as well as geo elevations or the magnetic field of the Earth.
• There were also examples on how to use multiple geo visualization functions: from GeoGraphics, GeoImage or DynamicGeoGraphics to GeoHistogram, GeoRegionValuePlot, GeoStreamPlot or GeoGraphPlot.
• This all makes the Wolfram Language a powerful environment to analyze, explore and visualize geographical data.
CITE THIS NOTEBOOK
CITE THIS NOTEBOOK
Wolfram R&D LIVE: Maps and Geo Computations
by Jose Martin-Garcia
Wolfram Community, STAFF PICKS, August 7, 2023
https://community.wolfram.com/groups/-/m/t/2985580
by Jose Martin-Garcia
Wolfram Community, STAFF PICKS, August 7, 2023
https://community.wolfram.com/groups/-/m/t/2985580