Rui Alves (rui.alves@udl.cat)
Ester Vilaprinyo (ester.vilaprinyo@udl.cat)
Alberto Marin- Sanguino (alberto.marin@udl.cat)
Jordi Bartolome (jordi.bartolome@udl.cat)
Francesc Solsona (francesc.solsona@udl.cat)
Albert Sorribas (albert.sorribas@udl.cat)
Departament de Ciències Mèdiques Bàsiques & Departament d’Informàtica i Enginyeria Industrial, Universitat de Lleida, Lleida, Spain
Abstract: SARSCoV2 is the cause of the COVID19 pandemic, which has been perturbing the normal functioning of human civilization since the final trimester of 2019. Here we present a user friendly interface that automatically fetches up-to-date data from the GitHub repository of the World Health Organization and uses it to represent the current state of the pandemic around the world and show how it progressed from its beginnings until now. We also implement user friendly functionality to fetch and represent data for Spanish autonomic regions and provinces. Finally, we provide an interface to compare any two regions in the data set.
Introduction
Introduction
The SARSCoV2 pandemic
The SARSCoV2 pandemic
SARSCoV2 is a zoonotic viral infection that started in China during the final trimester of 2019 and took the world by storm [1]. After first detection of SARSCoV2, an unprecedented international response was mounted to try and prevent the virus from becoming a pandemic [2]. Still, coordinating the response of hundreds of countries and thousands of organizations in the short time window that could have prevent the spread of the virus was impossible and the COVID19 pandemic spread through the world [3].
Many research initiatives were set in motion to follow the state of the pandemics in the various administrative regions of the world, and investigate how it could be stopped or, at least mitigated.
A lightning-fast vaccine program led to the deployment of five vaccines that were distributed and administered throughout the population of first world countries [4]. This curbed the development of new variants in these regions. However, because of the uneven vaccine distribution in poorer countries, SARSCoV2 infections remain rampant, leading to the appearance of newer, more infections variants. Some of these variants, such as delta or omicron, partially elude the protective power of earlier vaccines. This leads to the resurgence of newer waves of infection even in countries where more than 80% of the population is vaccinated. Still, while infections are not fully eliminated by the protections of early vaccines protection, serious symptoms are effectively a thing of the past.
Throughout the pandemic, several research programs were founded or adapted to collect the data that permitted health institutions to follow the progression of the infection and advice the political power on which decisions to take in order to curb the expansion of the pandemic. These research programs make the data available for all to us in open data repositories, facilitating the development of interfaces that can be used to represent the data in intuitive ways and enable quicker data analysis and decision making [5-6].
Here, we present the package COVID World, that reads SARSCoV2 pandemic data on the fly from the open repositories of the World Health Organization and the Spanish CSIC, and uses that data to represent the evolution of the pandemic in an up-to-date and user-friendly fashion.
COVID World
COVID World
Overall application design
Overall application design
COVID World was thought as a four pane application, which automatically updates its content on the fly through DynamicModule. In the first pane, we can follow the state of the application in the different regions of the world. The application is initialized in the first pane, showing up-to-date data regarding the progression of the pandemic considering the aggregated data for the entire human population. The second pane shows data for the autonomic communities in Spain. The third pane shows data for Spanish provinces. Users can compare the data for any two regions in the database in the fourth and final pane.
A pop-up menu allows the user to select which region or country to represent. Once this region is selected, a cartoon representation of a corona virus is presented, displaying current data (Figure 1).
A pop-up menu allows the user to select which region or country to represent. Once this region is selected, a cartoon representation of a corona virus is presented, displaying current data (Figure 1).
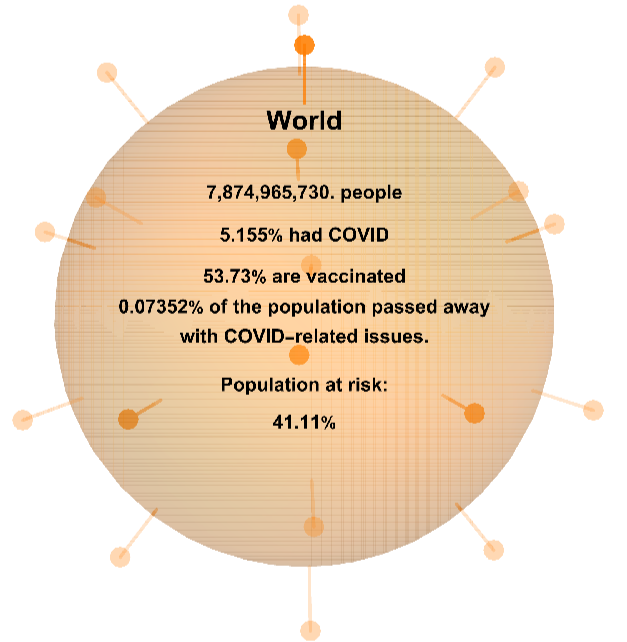
Figure 1. Summarizing the current state of the COVID infection in the world. The Corona Virus representation is colored as a function of percentage of unvaccinated population in the region. Green indicates that more than 80% of the population is vaccinated and/or recovered from at least one bout of the infection. Yellow indicates that between 50% and 80% of the population has been fully vaccinated or recovered from one bout of infection. Red indicates that 50% or more of the population is yet naive with respect to the infection (no infection or vaccine).
A RadioButtonBar follows this image, allowing users to select the specific data that should be represented. That data is then presented in a modified DateListPlot.
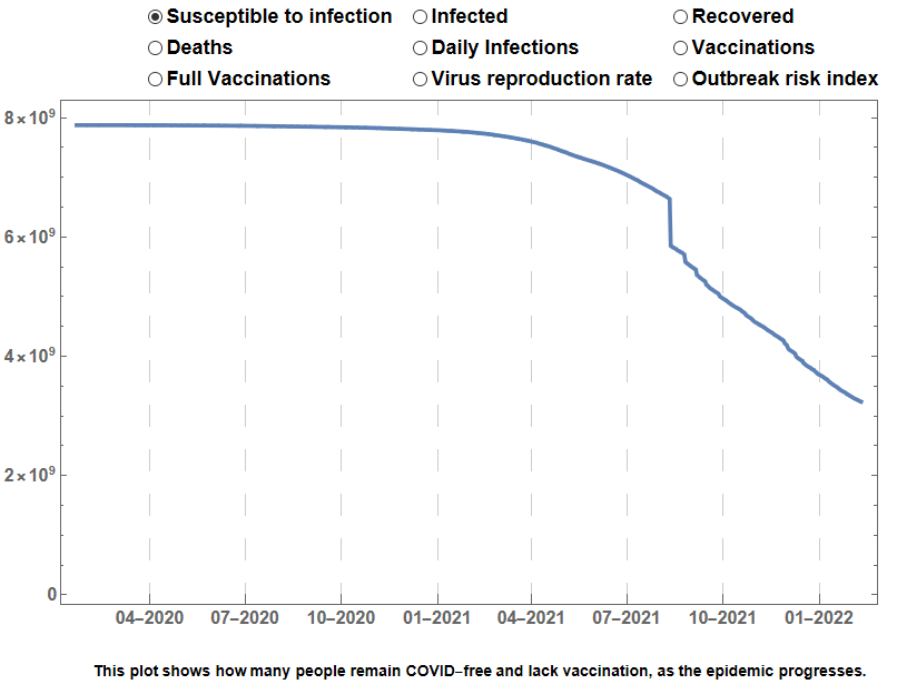
Figure 2. Selecting the specific type of data that should be represented. Susceptible population is calculated by subtracting the total number of infections and fully vaccinated people from the total population of the region. Deaths are calculated by adding up all reported deads up to the specific day. Full vaccinatioms are the reported number of people with complete vaccination schedule. Infected people is calculated by adding up all reported infections in the previous ten days. Daily infections represents the reported infections each day. The virus reproduction rate is calculated using the approach described in [7] and also represented directly from the WHO dataset. Recovered population is calculated by adding all infections up to ten days before the date and subtracting the deads. Outbreak ris index is calculated as reported in [8]
The World, Spanish autonomic communities, and Spanish provinces
The World, Spanish autonomic communities, and Spanish provinces
There are three panes where we represent data for a simple region. Their design and functioning is similar (Figure 3).
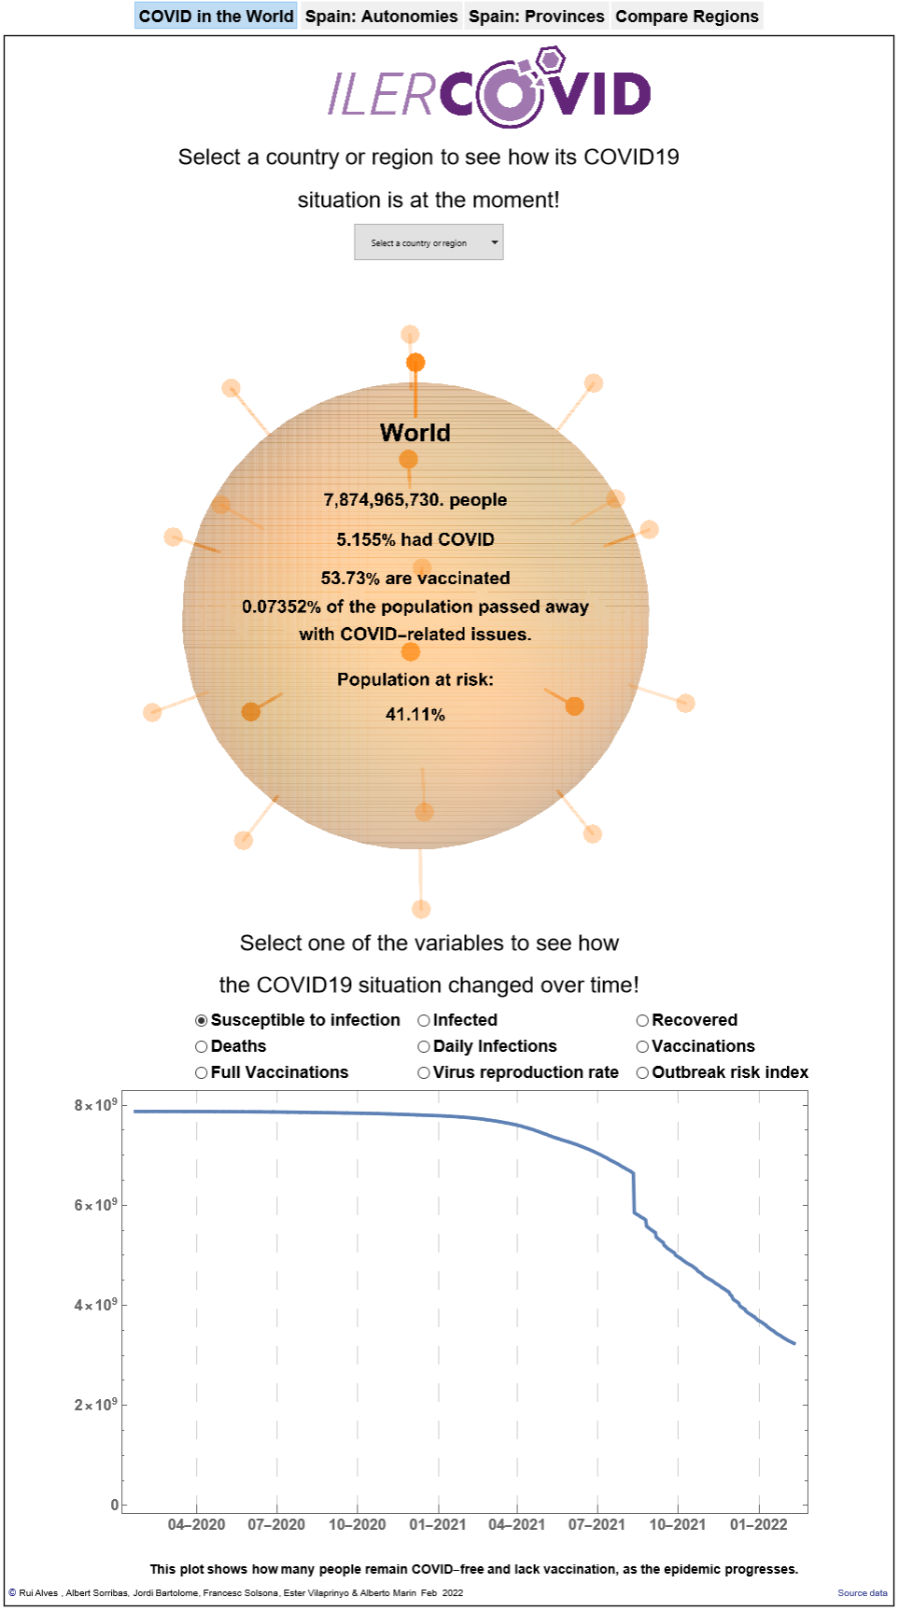
Figure 3. Overall design of single region panes.
The view in the fourth pane is split between the two regions that users choose to compare. Selection of regions and pandemic variables to represent is done as in the individual panes (Figure 4).
Data Analysis
Data Analysis
The data
The data
The data used by the application can be downloaded and read automatically from two GitHub repositories. The first olds the data for countries and supranational regions and is made available by the World Health Organization:
The second olds data for Spain, its autonomic communities, and provinces. It is made available by CSIC:
Reformatting the data
Reformatting the data
To reorganize the data we use the function GetRegionData[region_name,data_set,type_of_region]. This function is defined as a part of the COVIDWorld package. The interface automatically uses this function to select the appropriate dataset, extract the relevant variables, and calculate the ones that are not directly reported in the data. COVID World uses data as a dataset for the “COVID in the World” pane, dataca as the dataset for the “Spanish: Autonomies” pane, and dataprov for the “Spanish: Provinces” pane. The “Compare Regions” pane automatically determines the appropriate dataset, depending on whether the user selects “Country” (dataset data), “State” (dataset dataca), or Province (dataset dataprov).
The data matrix produced by the GetRegionData function has the following structure:
Creating the SARSCoV2 cartoon
Creating the SARSCoV2 cartoon
The reformatted data is then used to create a SARSCoV2 cartoon. First, the outline of the virus is created using the following function.
Representing the dynamic evolution of the pandemic
Representing the dynamic evolution of the pandemic
The evolution of COVID variables in a selected region is represented as a function of date in the lower part of each pane. DynamicModule and RadioButtonBar functions are combined to enable switching between variables. The data is represented using a function DLPlotFinal[data,x_axis_label,y_axis_label,which_variable,linear_or_logarithmic,image_size]. This function formats DateListPlot. Generating the plots for infections in the first three panes is done using the following code:
In turn, generating the plots for infections in the fourth panes needs to generate a smaller figure. This is done using the following code:
Starting COVID World
Starting COVID World
The COVID World package
The COVID World package
As is the case with all Mathematica packages, the standard option to install the package is by going to your “~/AddOns/Applications/” directory and create a COVIDWorld subdirectory, placing the COVIDWORLD.wl file in that directory. Then, you can run the app by running the following code
Summary
Summary
In this paper we present a user-friendly app to represent and analyze the progress of COVID in the world, its continents, and countries. We also choose Spain as an example to focus on and analyze the epidemic in smaller administrative regions.
Conclusion
Conclusion
While the app is specific for COVID pandemic data, it is easy to adapt it for other pandemic data.
Acknowledgments
Acknowledgments
This App was developed in the context of project IlerCOVID (2020PANDE00124) from Generalitat de Catalunya and Project FIS PI20/00377, from Instituto de Salud Carlos III.
References
References
A. Maxmen, “WHO report into COVID pandemic origins zeroes in on animal markets, not labs,” Nature, 592(7853), 2021 pp. 173–174. DOI: 10.1038/d41586-021-00865-8.
A. Sharma, IA Farouk, and SK Lal, “COVID-19: A Review on the Novel Coronavirus Disease Evolution, Transmission, Detection, Control and Prevention,” Viruses, 13(2), 2021 pp. 202. DOI: doi.org/10.3390/v13020202.
LO. Gostin, S Moon, and BM Meier, “Reimagining Global Health Governance in the Age of COVID-19,” Am. J. Public Health, 110(11), 2020 pp. 1615-1619. DOI: 10.2105/AJPH.2020.30593.
MA. Yu, AK. Shen MJ. Ryan and LL. Boulanger, “Coordinating COVID-19 vaccine deployment through the WHO COVID-19 Partners Platform,” Bull. World Health Organ., 99(3), 2021 pp. 171–171A. DOI: 10.2471/BLT.21.285550.
World Health Organization “WHO COVID Dashboard” (12/30/2021 ) covid19.who.int
Nextstrain “GISAID Covid Dashboard”, (12/30/2021) nextstrain.org/ncov/gisaid/global
S. Contreras, HA. Villavicencio, D. Medina-Ortiz, CP Saavedra and A. Olivera-Nappa, “Real-Time Estimation of Rt for Supporting Public-Health Policies Against COVID-19,” Front. Public Health 8, 2020 pp. 556689. DOI: 10.3389/fpubh.2020.556689.
M. Catala, M Marchena, D Conesa, P. Palacios, T. Urdiales,S. Alonso, E. Alvarez-Lacalle, D. Lopez, PJ Cardona and C Prats, “Monitoring and Analysis of COVID-19 Pandemic: The Need for an Empirical Approach” Front. Public Health, 9, 2021 pp. 806. DOI: doi.org/10.3389/fpubh.2021.633123.