This project explores the strategic placement of solar panels on Mars, taking into account the precise slopes of the Martian surface that directly face the Sun. By analyzing detailed Mars maps and employing interpolation techniques, the project aims to identify the optimal locations for solar panel installation. It further investigates solar incidence data and its visual representation, emphasizing the variations in solar energy availability during different seasons. Additionally, the project examines the challenges posed by dust storms, including their impact on the efficiency of solar panels and accessibility of solar energy for Mars rovers. The ultimate goal of this research is to advance our understanding of solar panel placement on Mars and its potential as a sustainable energy solution for future Martian missions.
Introduction
Introduction
Out[]=

The exploration and potential colonization of Mars have garnered significant attention in recent years . With the aim of establishing sustainable habitats and powering scientific missions, harnessing solar energy stands out as a promising solution . However, the unique environmental conditions on Mars, including its axial tilt, terrain variations, and seasonal changes, necessitate a comprehensive analysis to determine optimal locations for solar panel placement . This project focuses on leveraging solar incidence and terrain data to identify suitable sites for solar panel installation on the Martian surface and for rover explorations. The primary objective of this project is to develop an optimization algorithm to determine optimal locations for solar panel placement on Mars. The algorithm will aim to maximize the energy output of solar panels and ensure sustained power supply for future rovers.
Latitude/Longitude/Heights
Latitude/Longitude/Heights
On Mars, the latitude ranges from approximately -90° at the south pole to +90° at the north pole. The longitude range on Mars is from -180° to +180°, with the prime meridian passing through a specific location on Mars known as the “Iani Chaos” region.
In[]:=
{{minlat,maxlat},{minlon,maxlon}}={{-90,90},{-180,180}}
Out[]=
{{-90,90},{-180,180}}
After specifying latitude and longitude ranges we can get an elevation map , which lets us to extract a height of every area on Mars . We will need the heights for creating a relief map of Mars.
In[]:=
marsmap=GeoElevationData[{{minlat,minlon},{maxlat,maxlon}},GeoModel->"Mars"];heights=QuantityMagnitude[GeoElevationData[{{minlat,minlon},{maxlat,maxlon}},GeoModel->"Mars"],"Kilometers"];
The height of different areas on Mars are represented in the form of matrix. As we got a matrix of heights values, the next step is to get a list of dimensions of the matrix for knowing what the resolution of Mars map will be.
In[]:=
{nlat,nlong}=Dimensions[heights]
Out[]=
{360,720}
Latlons function creates a grid of latitude and longitude coordinates with specified ranges and resolutions, providing a structured way to represent geographic locations.
In[]:=
latlons=Table[{lat,lon},{lat,minlat,maxlat,(maxlat-minlat)/(nlat-1)},{lon,minlon,maxlon,(maxlon-minlon)/(nlong-1)}]//N;
Interpolations, Derivatives and Slopes
Interpolations, Derivatives and Slopes
We use interpolation, derivative and arc tangent functions for finding angles of slopes on Martian surface.
In the context of Mars surface analysis, interpolation allows us to create a continuous representation of the terrain based on discrete measurements of latitudes, longitudes and heights. We use derivative function to calculate the slope or gradient of the terrain at specific points.
In the context of Mars surface analysis, interpolation allows us to create a continuous representation of the terrain based on discrete measurements of latitudes, longitudes and heights. We use derivative function to calculate the slope or gradient of the terrain at specific points.
In[]:=
interpolationOfTheSurface=Interpolation[Flatten[MapThread[Flatten[{##}]&,{latlons,heights},2],1]];
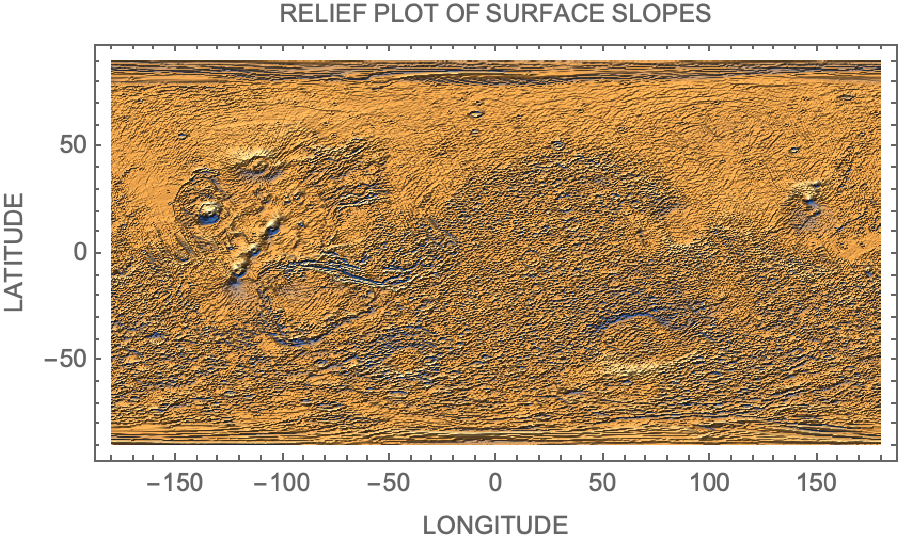
The variables pplon and pplat represent the number of longitude and latitude points in the grid, respectively. The step size for each measurement is calculated based on the number of points (pplat and pplon) to distribute the calculations evenly. By taking derivatives of the interpolations of the surface we are getting slopes, and by applying ArcTan to each slope we are getting all slope angles. The resulting allLatSlopeAngles table contains the angles of inclination at each latitude and longitude point on the surface, based on the provided interpolationOfTheSurface interpolation function. These angles represent the steepness of the surface at each location.
In[]:=
{pplon,pplat}={nlong,nlat};allLatSlopeAngles=Table[Evaluate[ArcTan[D[interpolationOfTheSurface[lat,lon],lat]]],{lat,minlat,maxlat,(maxlat-minlat)/pplat},{lon,minlon,maxlon,(maxlon-minlon)/pplon}];
Knowing the slopes of the Mars surface is crucial for solar panel placement . Solar panels work most efficiently when exposed to direct sunlight . By knowing the slope angle at different locations, we can identify areas that receive maximum sunlight. Ideally, solar panels should be placed on relatively flat terrain to optimize sunlight exposure and energy production .
Mars Map
Mars Map
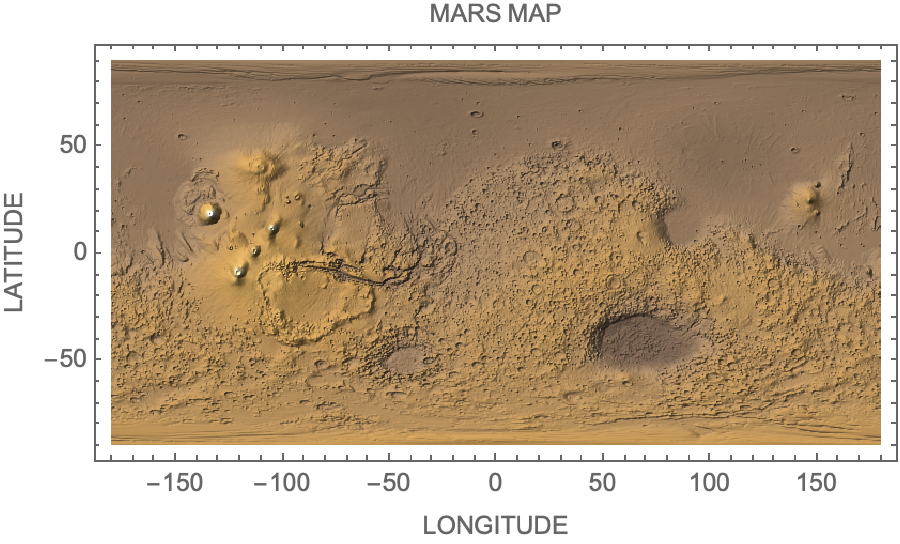
Marsmap2 is a relief plot that is created by taking all heights at different points of Mars. It basically represents the surface map of the whole Mars.
In[]:=
marsmap2[name_]:=ReliefPlot[Reverse[heights],DataRange{{-180,180},{-90,90}},Frame->True,FrameLabel->{{"LATITUDE",None},{"LONGITUDE",name}},FrameTicksTrue,AspectRatio->Automatic,ColorFunction->"CoffeeTones"]
In[]:=
marsmap2["MARS MAP"]
Out[]=
We create a relief map of all slope values that are in the North/South direction
In[]:=
ReliefPlot[Reverse[allLatSlopeAngles],DataRange->{{-180,180},{-90,90}},Frame->True,FrameLabel->{{"LATITUDE",None},{"LONGITUDE","RELIEF PLOT OF SURFACE SLOPES"}},FrameTicksTrue,AspectRatio->Automatic,PlotRange->All]
Out[]=
Solar Incidence
Solar Incidence
The axial tilt of a planet refers to the angle between its rotational axis and the perpendicular to its orbital plane. In the case of Mars, its axial tilt is approximately 25 degrees. Due to the axial tilt, Mars experiences seasons similar to Earth. As Mars orbits the Sun, different hemispheres receive varying amounts of sunlight. The tilt causes variations in sunlight intensity and duration throughout the Martian year.
Alpha angles represent angles of incidence of the sun that changes accordingly to Mars position through a year (Ω - represents declination angle of mars from the sun in a particular time of a year).
Alpha angles represent angles of incidence of the sun that changes accordingly to Mars position through a year (Ω - represents declination angle of mars from the sun in a particular time of a year).
In[]:=
alphaangles[Ω_]:=Table[Evaluate[{lat,lon,-lat+25*Sin[Ω]}],{lat,minlat,maxlat,(maxlat-minlat)/pplat},{lon,minlon,maxlon,(maxlon-minlon)/pplon}]
The relief plot of alpha angles shows angles of sun hitting the surface depending on Ω
In[]:=
reliefplotofalpha[Ω_]:=ReliefPlot[alphaangles[Ω][[All,All,3]],AspectRatio1/2,DataRange->{{minlon,maxlon},{minlat,maxlat}},FrameTrue,FrameTicksTrue,PlotLegends->Automatic]
It is important to find places with the right slope towards the sun. The function “correctslope” checks if all slopes correspond to a certain range in which they are directed towards the sun. If the slope is between angles of incidence of the sun ± 5degrees - it is the correct slope and we highlight that place. If the slope doesn’t correspond the parameter of angles of incidence of the sun ± 5degrees - then it is not a good slope for placing solar panel on.
In[]:=
correctslope[Ω_]:=Table[Evaluate[{lat,lon,If[ArcTan[D[interpolationOfTheSurface[lat,lon],lat]]*180/π>-lat+25*Sin[Ω]-5&&ArcTan[D[interpolationOfTheSurface[lat,lon],lat]]*180/π<-lat+25*Sin[Ω]+5,1,0]}],{lat,minlat,maxlat,(maxlat-minlat)/pplat},{lon,minlon,maxlon,(maxlon-minlon)/pplon}]
Visualization of Solar Incidence Data
Visualization of Solar Incidence Data
To visualise solar incidence data we use ArrayPlot function which generates a plot in which the values of correct slopes of sun incidence change throughout the year, are shown in a discrete array of squares. We create array plots for 100 different martian days - therefore, all array plots are different.
In[]:=
sunIncidencePlot1=Table[ArrayPlot[correctslope[Ω][[All,All,3]],AspectRatio1/2,ColorFunctionScalingFalse,DataRange->{{-180,180},{-90,90}},FrameTrue,FrameTicksNone,PlotLegends->{None,"Sun Incidence"},ColorRules->{1->Yellow,0->Transparent}],{Ω,0,2π,2Pi/100}];
In[]:=
maps2=Show[marsmap2["SUN INCIDENCE MAP"],#]&/@sunIncidencePlot1;
In[]:=
ListAnimate[maps2]
Out[]=
The discrete array of squares in the ArrayPlot represents different regions on Mars, and each yellow square corresponds to the value of the correct slopes of sun incidence at that location . By generating a sequence of ArrayPlot visualizations for different Martian days, we can observe how the solar incidence changes over time and identify any patterns or variations.
Solar Incidence while Season Changes
Solar Incidence while Season Changes
To see the difference between areas on Mars that get direct sunlight throughout the year, we make a dynamic visualization of solar incidence while the seasons change. It combines a series of ArrayPlot visualizations for different Martian days with a Martian map showing the changing seasons.
Spacecrafts on Mars and Their Solar Accessibility
Spacecrafts on Mars and Their Solar Accessibility
When launching rovers, it is important to understand where they will be located, because their ability to collect energy from the sun is very important for their functioning. The rovers will not be able to collect sufficient sunlight if the slope of the terrain is too far from the solar incidence angle. We can analyze the locations of the rovers that are already on Mars to see if they could efficiently collect sunlight.
We start to explore rovers’ locations by defining their precise coordinates.
We start to explore rovers’ locations by defining their precise coordinates.
For creating spacecraftMapMaker function we combine multiple elements from functions that we got before.
When we analyze the maps on which the rovers are located, it is immediately clear that Perseverance has much less access to the sun, while all other are located in pretty much sun illuminated places. Perseverance carries a radioisotope power system. This power system produces a dependable flow of electricity using the heat of plutonium’s radioactive decay as its “fuel.”, so it doesn’t need to be located at sun sufficient place.
Other spacecraft and rovers that rely on solar panels for power generation require sufficient sunlight exposure to ensure optimal energy production. These solar-powered systems utilize photovoltaic cells to convert sunlight into electrical energy. Placing them in areas with high sun incidence, such as locations near the equator on Mars, allows for direct and prolonged exposure to sunlight, maximizing power generation potential. The equatorial regions of Mars receive more direct sunlight compared to higher latitudes. This is due to the tilt of Mars’ rotational axis, which affects the distribution of sunlight across the planet. Locating spacecraft and rovers near the equator provides the advantage of higher and more consistent sun incidence throughout the year. This allows for more efficient energy capture and reduces the reliance on alternative power sources or frequent recharging.
Other spacecraft and rovers that rely on solar panels for power generation require sufficient sunlight exposure to ensure optimal energy production. These solar-powered systems utilize photovoltaic cells to convert sunlight into electrical energy. Placing them in areas with high sun incidence, such as locations near the equator on Mars, allows for direct and prolonged exposure to sunlight, maximizing power generation potential. The equatorial regions of Mars receive more direct sunlight compared to higher latitudes. This is due to the tilt of Mars’ rotational axis, which affects the distribution of sunlight across the planet. Locating spacecraft and rovers near the equator provides the advantage of higher and more consistent sun incidence throughout the year. This allows for more efficient energy capture and reduces the reliance on alternative power sources or frequent recharging.
Solar Incidence on 3D Model of Mars
Solar Incidence on 3D Model of Mars
Solar incidence on 3D model of Mars represents the same information as flat sun incidence map. However, 3D model of Mars provides a more comprehensive representation of how sunlight is distributed across the planet’s surface compared to a flat sun incidence map. The 3D model allows us to visualize and understand how solar energy is actually spread over the terrain, taking into account the varying elevations and slopes present on Mars.
By incorporating the three-dimensional aspect, the model showcases how sunlight interacts with the Martian topography, revealing areas of potential shadowing and regions that receive maximum direct exposure to the Sun.
By incorporating the three-dimensional aspect, the model showcases how sunlight interacts with the Martian topography, revealing areas of potential shadowing and regions that receive maximum direct exposure to the Sun.
Dust Storms
Dust Storms
Mars is known for its dust storms, some of which can be severe and cover the entire planet. These storms can significantly reduce the amount of sunlight reaching the surface.
Dust storms can have significant impacts on rovers and their operations. The fine dust particles can enter sensitive components, such as motors, joints, and electronic systems, leading to potential malfunctions or reduced efficiency. The reduced sunlight can also affect the rover’s solar-powered batteries, limiting their charging capabilities. Knowledge of dust storm patterns and areas prone to severe storms helps in mission planning.
We overplayed map that shows the distribution of dust across the surface of Mars over relief map of Mars and placed markers on the places where rovers are located.
Conclusion, Limitations and Future Work
Conclusion, Limitations and Future Work
In this project we identified optimal locations for solar panel placement. The project also highlighted the importance of proper placement for solar-powered spacecraft and rovers to ensure sufficient energy supply for their operations. It emphasized the need to locate these assets in areas with high sun incidence, preferably near the equator, to maximize solar energy collection and minimize reliance on alternative power sources. Overall, this project contributed to the understanding of solar panel placement on Mars and provided a foundation for future research in this field.
Limitations of the project include uncertainties in the dust distribution data and the generalized nature of the rover locations . Future work could focus on refining these aspects by incorporating more precise data on dust storm patterns and rover positions . Additionally, the project could expand to consider other factors such as wind patterns, geographical features, and optimal power management strategies during dust storms .
Limitations of the project include uncertainties in the dust distribution data and the generalized nature of the rover locations . Future work could focus on refining these aspects by incorporating more precise data on dust storm patterns and rover positions . Additionally, the project could expand to consider other factors such as wind patterns, geographical features, and optimal power management strategies during dust storms .
Acknowledgments
Acknowledgments
I want to thank to my mentor Jack Madden and all directors and stuff of the WSRP program.
References
References
CITE THIS NOTEBOOK
CITE THIS NOTEBOOK
Solar panels placement on Mars
by Alisa Zaitseva
Wolfram Community, STAFF PICKS, July 13, 2023
https://community.wolfram.com/groups/-/m/t/2965299
by Alisa Zaitseva
Wolfram Community, STAFF PICKS, July 13, 2023
https://community.wolfram.com/groups/-/m/t/2965299